29
/
en
AIzaSyAYiBZKx7MnpbEhh9jyipgxe19OcubqV5w
April 1, 2024
124719
Egypt, Arab Rep.
EGY
true
2
1
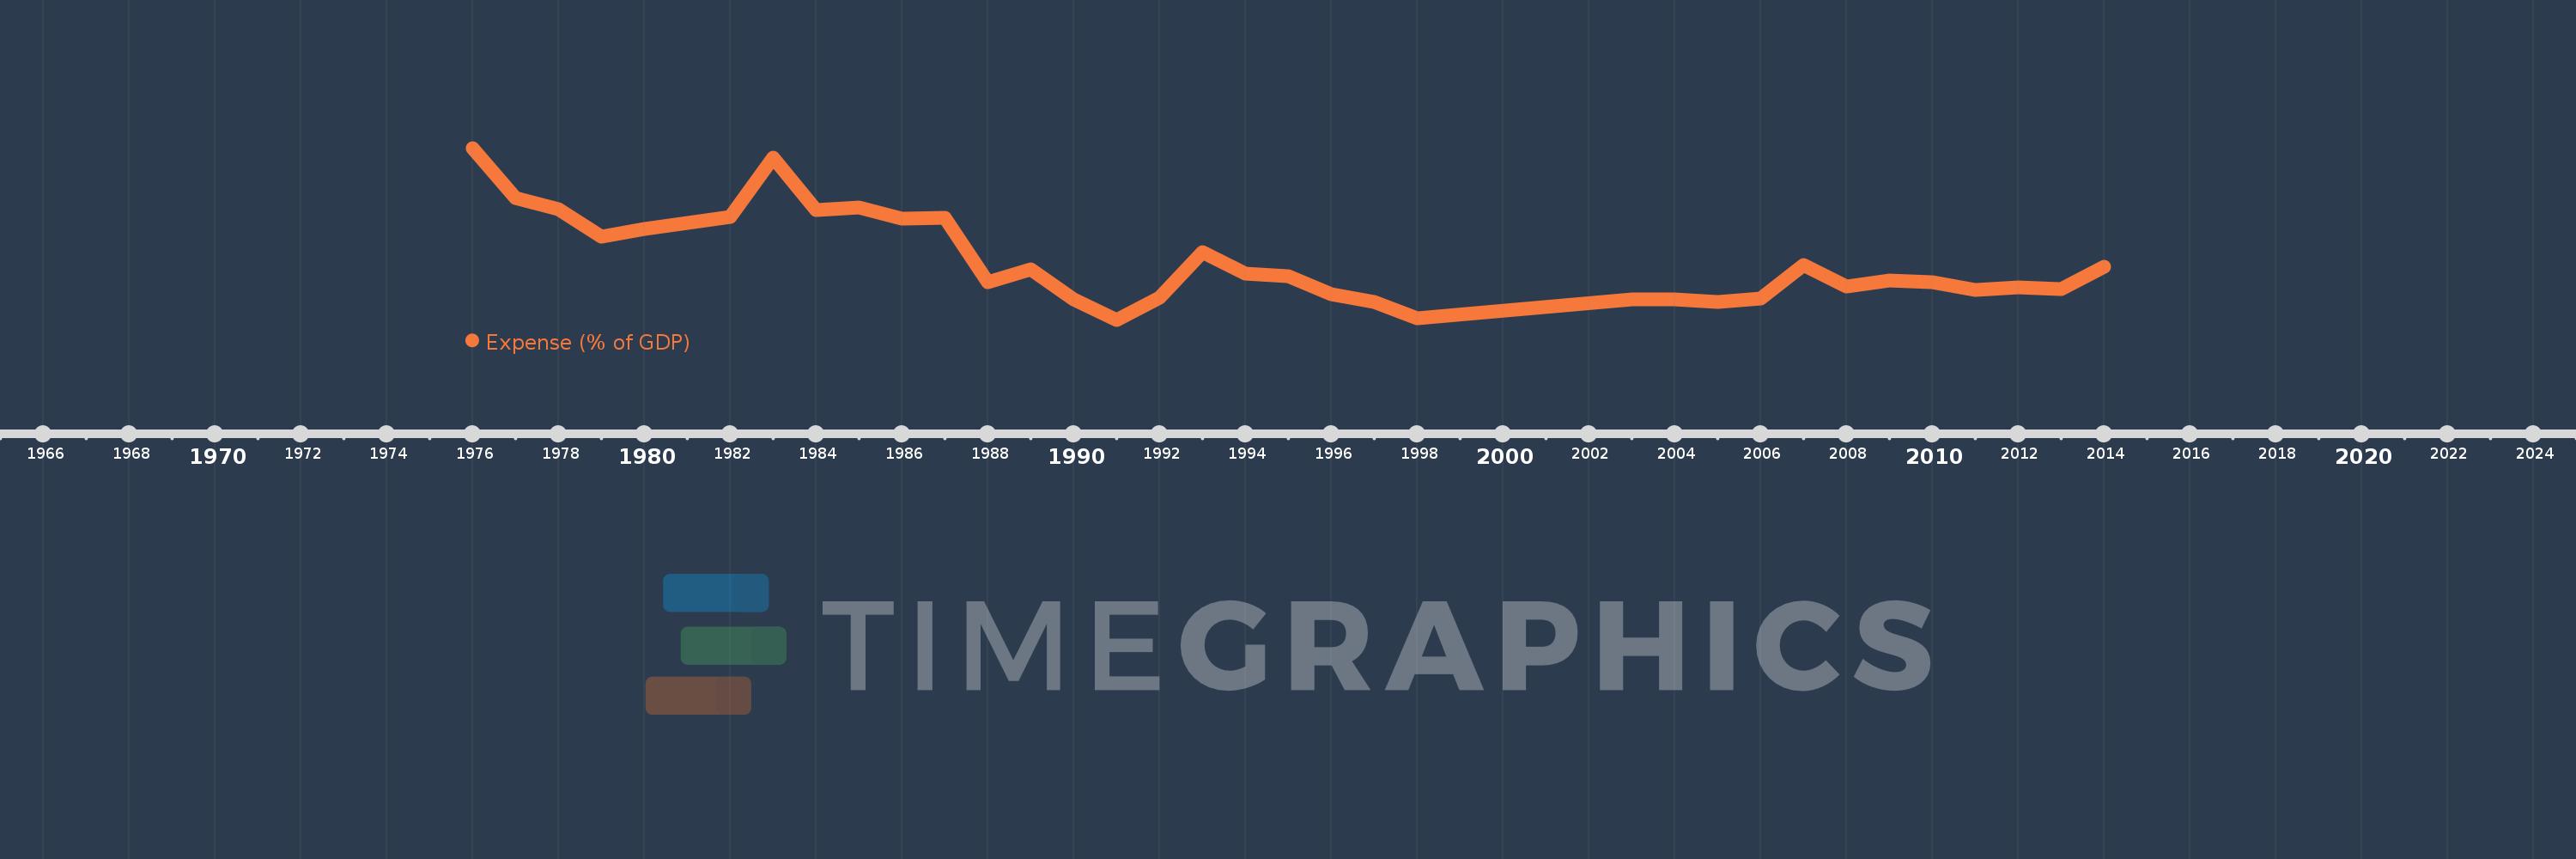
Expense (% of GDP)
2014,2013,2012,2011,2010,2009,2008,2007,2006,2005,2004,2003,1998,1997,1996,1995,1994,1993,1992,1991,1990,1989,1988,1987,1986,1985,1984,1983,1982,1980,1979,1978,1977,1976
This statistics in other country:
AfghanistanAlbaniaAlgeriaAngolaAntigua and BarbudaArmeniaAustraliaAustriaAzerbaijanBahamas, TheBahrainBangladeshBarbadosBelarusBelgiumBelizeBeninBhutanBoliviaBosnia and HerzegovinaBotswanaBrazilBulgariaBurkina FasoBurundiCabo VerdeCambodiaCanadaCaribbean small statesCentral African RepublicCentral Europe and the BalticsChileColombiaCongo, Dem. Rep.Congo, Rep.Costa RicaCote d'IvoireCroatiaCyprusCzech RepublicDenmarkDominicaDominican RepublicEarly-demographic dividendEgypt, Arab Rep.El SalvadorEquatorial GuineaEstoniaEthiopiaEuro areaEurope & Central AsiaEurope & Central Asia (excluding high income)Europe & Central Asia (IDA & IBRD countries)European UnionFijiFinlandFranceGambia, TheGeorgiaGermanyGhanaGreeceGrenadaGuatemalaHeavily indebted poor countries (HIPC)High incomeHondurasHong Kong SAR, ChinaHungaryIcelandIDA blendIDA onlyIDA totalIndiaIndonesiaIran, Islamic Rep.IraqIrelandIsraelItalyJamaicaJapanJordanKazakhstanKenyaKiribatiKorea, Rep.KuwaitKyrgyz RepublicLao PDRLatin America & Caribbean Latin America & Caribbean (excluding high income)Latin America & the Caribbean (IDA & IBRD countries)LatviaLeast developed countries: UN classificationLebanonLesothoLiberiaLithuaniaLow incomeLower middle incomeLuxembourgMacao SAR, ChinaMacedonia, FYRMadagascarMalawiMalaysiaMaldivesMaliMaltaMauritiusMexicoMicronesia, Fed. Sts.Middle East & North Africa (excluding high income)Middle East & North Africa (IDA & IBRD countries)MoldovaMongoliaMoroccoMozambiqueMyanmarNamibiaNepalNetherlandsNew ZealandNicaraguaNigeriaNorth AmericaNorwayOECD membersOmanOther small statesPacific island small statesPakistanPanamaPapua New GuineaParaguayPeruPhilippinesPolandPortugalPost-demographic dividendPre-demographic dividendQatarRomaniaRussian FederationRwandaSamoaSan MarinoSao Tome and PrincipeSenegalSerbiaSeychellesSierra LeoneSingaporeSlovak RepublicSloveniaSmall statesSolomon IslandsSouth AfricaSouth AsiaSouth Asia (IDA & IBRD)SpainSri LankaSt. Kitts and NevisSt. LuciaSub-Saharan Africa Sub-Saharan Africa (excluding high income)Sub-Saharan Africa (IDA & IBRD countries)SurinameSwazilandSwedenSwitzerlandSyrian Arab RepublicTajikistanTanzaniaThailandTimor-LesteTogoTrinidad and TobagoTunisiaTurkeyUgandaUkraineUnited Arab EmiratesUnited KingdomUnited StatesUruguayVanuatuVenezuela, RBVietnamWest Bank and GazaWorldYemen, Rep.ZambiaZimbabwe Timeline:
This timeline shows a graph from 1976 to 2014 of Egypt, Arab Rep.. No data until 1975. Number of actual observations by date: 34.
Source name:
World Development Indicators
Source organization:
International Monetary Fund, Government Finance Statistics Yearbook and data files, and World Bank and OECD GDP estimates.
Categories, topics:
Economy & Growth, Public Sector
Last updated:
apr 23, 2017
Indicators value changes by year
Minimum:
24.029
jan 1, 1991
Maximum:
51.629
jan 1, 1976
At the date of observation
Value
Absolute change
Change from previous value
jan 1, 1976
51.629
+51.629
0.0%
jan 1, 1977
43.6
-8.029
-15.55%
jan 1, 1978
41.755
-1.846
-4.23%
jan 1, 1979
37.346
-4.409
-10.56%
jan 1, 1980
38.67
+1.324
3.55%
jan 1, 1982
40.502
+1.832
4.74%
jan 1, 1983
50.103
+9.601
23.71%
jan 1, 1984
41.605
-8.498
-16.96%
jan 1, 1985
42.075
+0.47
1.13%
jan 1, 1986
40.318
-1.757
-4.18%
jan 1, 1987
40.473
+0.156
0.39%
jan 1, 1988
30.111
-10.363
-25.6%
jan 1, 1989
32.092
+1.981
6.58%
jan 1, 1990
27.303
-4.789
-14.92%
jan 1, 1991
24.029
-3.274
-11.99%
jan 1, 1992
27.621
+3.592
14.95%
jan 1, 1993
34.944
+7.323
26.51%
jan 1, 1994
31.485
-3.459
-9.9%
jan 1, 1995
31.0
-0.485
-1.54%
jan 1, 1996
28.125
-2.875
-9.27%
jan 1, 1997
26.948
-1.177
-4.18%
jan 1, 1998
24.232
-2.716
-10.08%
jan 1, 2003
27.248
+3.016
12.45%
jan 1, 2004
27.332
+0.084
0.31%
jan 1, 2005
26.89
-0.442
-1.62%
jan 1, 2006
27.389
+0.498
1.85%
jan 1, 2007
32.764
+5.375
19.62%
jan 1, 2008
29.335
-3.428
-10.46%
jan 1, 2009
30.318
+0.983
3.35%
jan 1, 2010
30.077
-0.241
-0.8%
jan 1, 2011
28.86
-1.217
-4.05%
jan 1, 2012
29.19
+0.33
1.14%
jan 1, 2013
29.003
-0.187
-0.64%
jan 1, 2014
32.492
+3.489
12.03%
Ranking of countries by current statistics by years


Comments: