29
/
en
AIzaSyAYiBZKx7MnpbEhh9jyipgxe19OcubqV5w
April 1, 2024
269247
Turkey
TUR
true
2
1
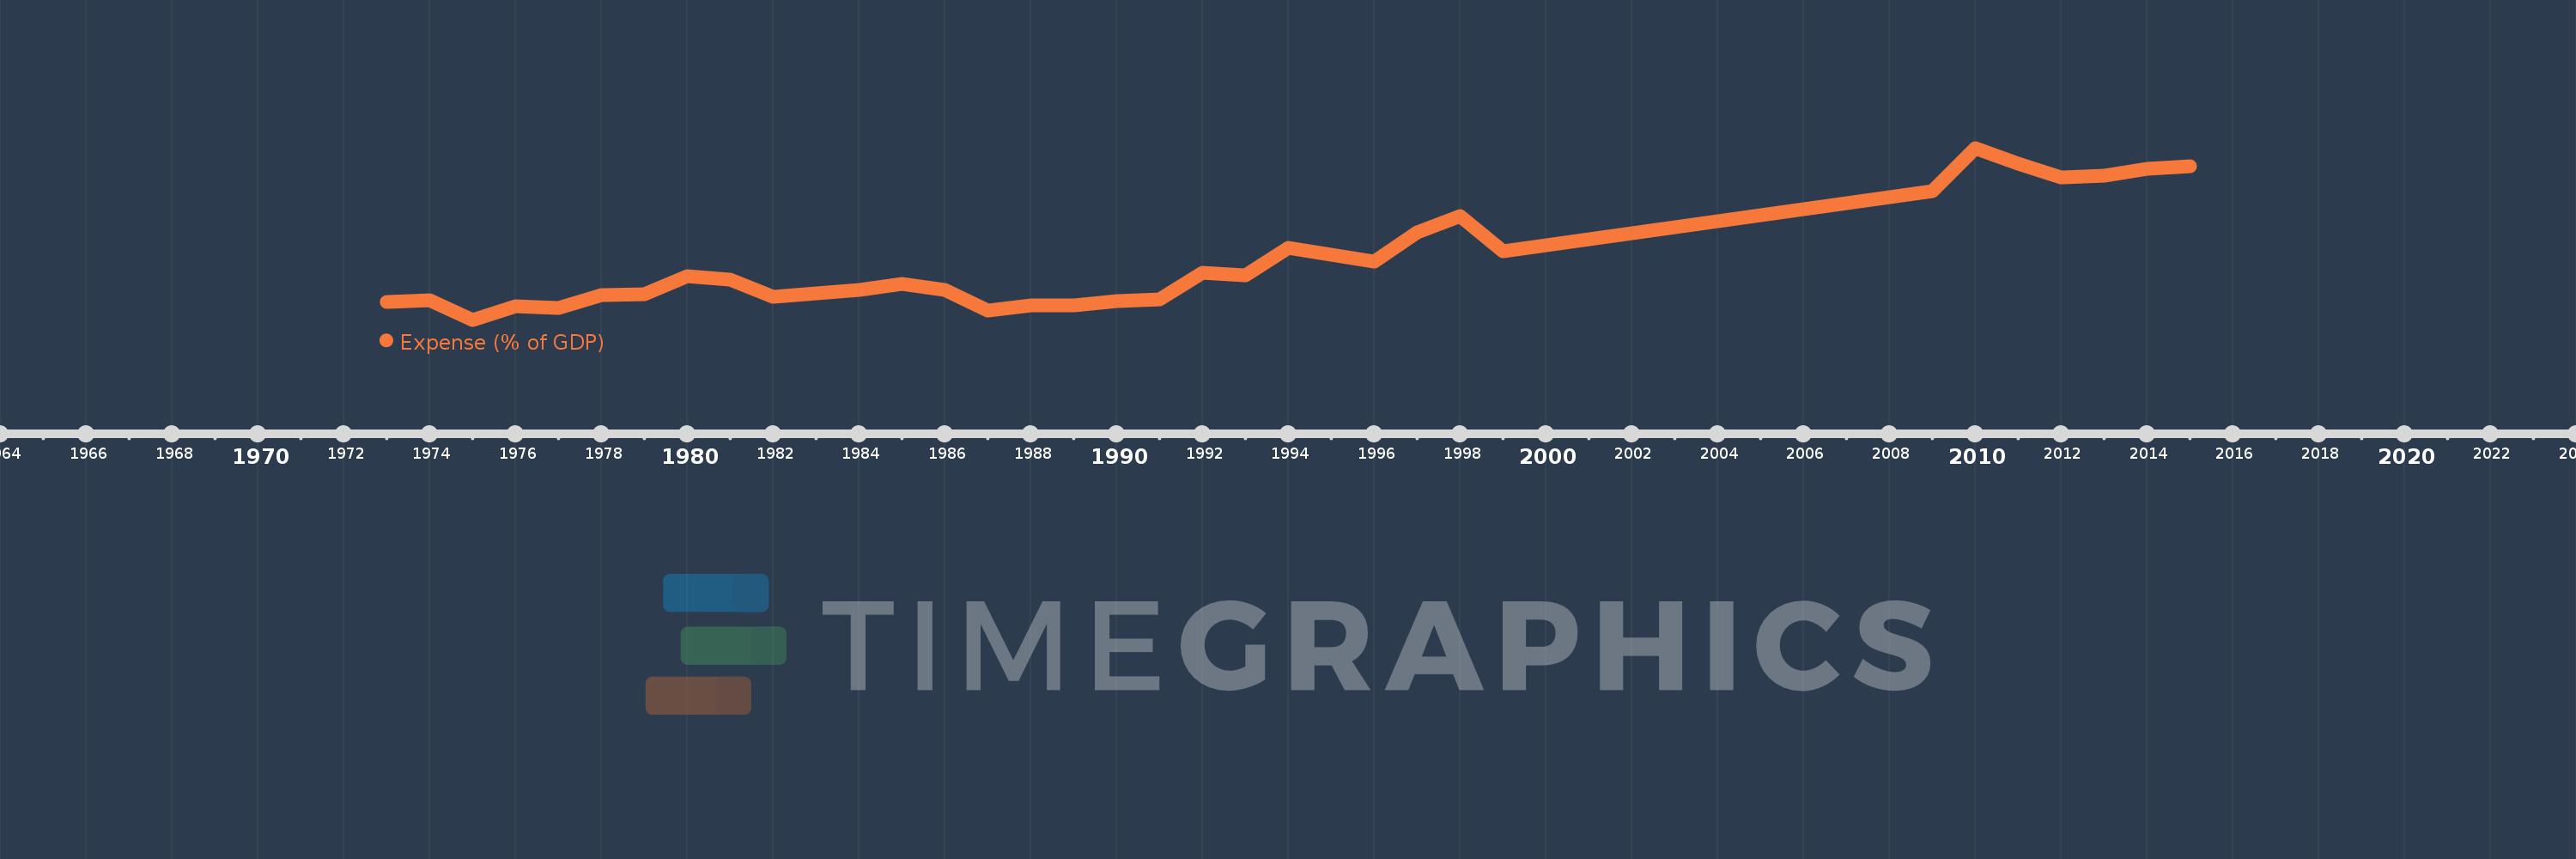
Expense (% of GDP)
2015,2014,2013,2012,2011,2010,2009,1999,1998,1997,1996,1995,1994,1993,1992,1991,1990,1989,1988,1987,1986,1985,1984,1982,1981,1980,1979,1978,1977,1976,1975,1974,1973
This statistics in other country:
AfghanistanAlbaniaAlgeriaAngolaAntigua and BarbudaArmeniaAustraliaAustriaAzerbaijanBahamas, TheBahrainBangladeshBarbadosBelarusBelgiumBelizeBeninBhutanBoliviaBosnia and HerzegovinaBotswanaBrazilBulgariaBurkina FasoBurundiCabo VerdeCambodiaCanadaCaribbean small statesCentral African RepublicCentral Europe and the BalticsChileColombiaCongo, Dem. Rep.Congo, Rep.Costa RicaCote d'IvoireCroatiaCyprusCzech RepublicDenmarkDominicaDominican RepublicEarly-demographic dividendEgypt, Arab Rep.El SalvadorEquatorial GuineaEstoniaEthiopiaEuro areaEurope & Central AsiaEurope & Central Asia (excluding high income)Europe & Central Asia (IDA & IBRD countries)European UnionFijiFinlandFranceGambia, TheGeorgiaGermanyGhanaGreeceGrenadaGuatemalaHeavily indebted poor countries (HIPC)High incomeHondurasHong Kong SAR, ChinaHungaryIcelandIDA blendIDA onlyIDA totalIndiaIndonesiaIran, Islamic Rep.IraqIrelandIsraelItalyJamaicaJapanJordanKazakhstanKenyaKiribatiKorea, Rep.KuwaitKyrgyz RepublicLao PDRLatin America & Caribbean Latin America & Caribbean (excluding high income)Latin America & the Caribbean (IDA & IBRD countries)LatviaLeast developed countries: UN classificationLebanonLesothoLiberiaLithuaniaLow incomeLower middle incomeLuxembourgMacao SAR, ChinaMacedonia, FYRMadagascarMalawiMalaysiaMaldivesMaliMaltaMauritiusMexicoMicronesia, Fed. Sts.Middle East & North Africa (excluding high income)Middle East & North Africa (IDA & IBRD countries)MoldovaMongoliaMoroccoMozambiqueMyanmarNamibiaNepalNetherlandsNew ZealandNicaraguaNigeriaNorth AmericaNorwayOECD membersOmanOther small statesPacific island small statesPakistanPanamaPapua New GuineaParaguayPeruPhilippinesPolandPortugalPost-demographic dividendPre-demographic dividendQatarRomaniaRussian FederationRwandaSamoaSan MarinoSao Tome and PrincipeSenegalSerbiaSeychellesSierra LeoneSingaporeSlovak RepublicSloveniaSmall statesSolomon IslandsSouth AfricaSouth AsiaSouth Asia (IDA & IBRD)SpainSri LankaSt. Kitts and NevisSt. LuciaSub-Saharan Africa Sub-Saharan Africa (excluding high income)Sub-Saharan Africa (IDA & IBRD countries)SurinameSwazilandSwedenSwitzerlandSyrian Arab RepublicTajikistanTanzaniaThailandTimor-LesteTogoTrinidad and TobagoTunisiaTurkeyUgandaUkraineUnited Arab EmiratesUnited KingdomUnited StatesUruguayVanuatuVenezuela, RBVietnamWest Bank and GazaWorldYemen, Rep.ZambiaZimbabwe Timeline:
This timeline shows a graph from 1973 to 2015 of Turkey. No data until 1972. Number of actual observations by date: 33.
Source name:
World Development Indicators
Source organization:
International Monetary Fund, Government Finance Statistics Yearbook and data files, and World Bank and OECD GDP estimates.
Categories, topics:
Economy & Growth, Public Sector
Last updated:
apr 23, 2017
Indicators value changes by year
Minimum:
12.283
jan 1, 1975
Maximum:
37.715
jan 1, 2010
At the date of observation
Value
Absolute change
Change from previous value
jan 1, 1973
14.908
+14.908
0.0%
jan 1, 1974
15.137
+0.229
1.54%
jan 1, 1975
12.283
-2.854
-18.86%
jan 1, 1976
14.226
+1.943
15.82%
jan 1, 1977
14.079
-0.147
-1.03%
jan 1, 1978
15.924
+1.844
13.1%
jan 1, 1979
16.057
+0.133
0.84%
jan 1, 1980
18.721
+2.665
16.6%
jan 1, 1981
18.241
-0.481
-2.57%
jan 1, 1982
15.726
-2.515
-13.79%
jan 1, 1984
16.753
+1.027
6.53%
jan 1, 1985
17.537
+0.785
4.68%
jan 1, 1986
16.727
-0.81
-4.62%
jan 1, 1987
13.669
-3.058
-18.28%
jan 1, 1988
14.444
+0.774
5.67%
jan 1, 1989
14.44
-0.004
-0.03%
jan 1, 1990
14.985
+0.545
3.78%
jan 1, 1991
15.296
+0.311
2.07%
jan 1, 1992
19.233
+3.938
25.74%
jan 1, 1993
18.867
-0.366
-1.9%
jan 1, 1994
22.935
+4.068
21.56%
jan 1, 1995
21.935
-1.0
-4.36%
jan 1, 1996
20.955
-0.98
-4.47%
jan 1, 1997
25.173
+4.218
20.13%
jan 1, 1998
27.571
+2.398
9.53%
jan 1, 1999
22.391
-5.18
-18.79%
jan 1, 2009
31.27
+8.879
39.66%
jan 1, 2010
37.715
+6.444
20.61%
jan 1, 2011
35.425
-2.289
-6.07%
jan 1, 2012
33.311
-2.114
-5.97%
jan 1, 2013
33.592
+0.281
0.84%
jan 1, 2014
34.628
+1.036
3.08%
jan 1, 2015
34.961
+0.333
0.96%
Ranking of countries by current statistics by years


Comments: