29
/
en
AIzaSyAYiBZKx7MnpbEhh9jyipgxe19OcubqV5w
April 1, 2024
85865
Bhutan
BTN
true
2
1
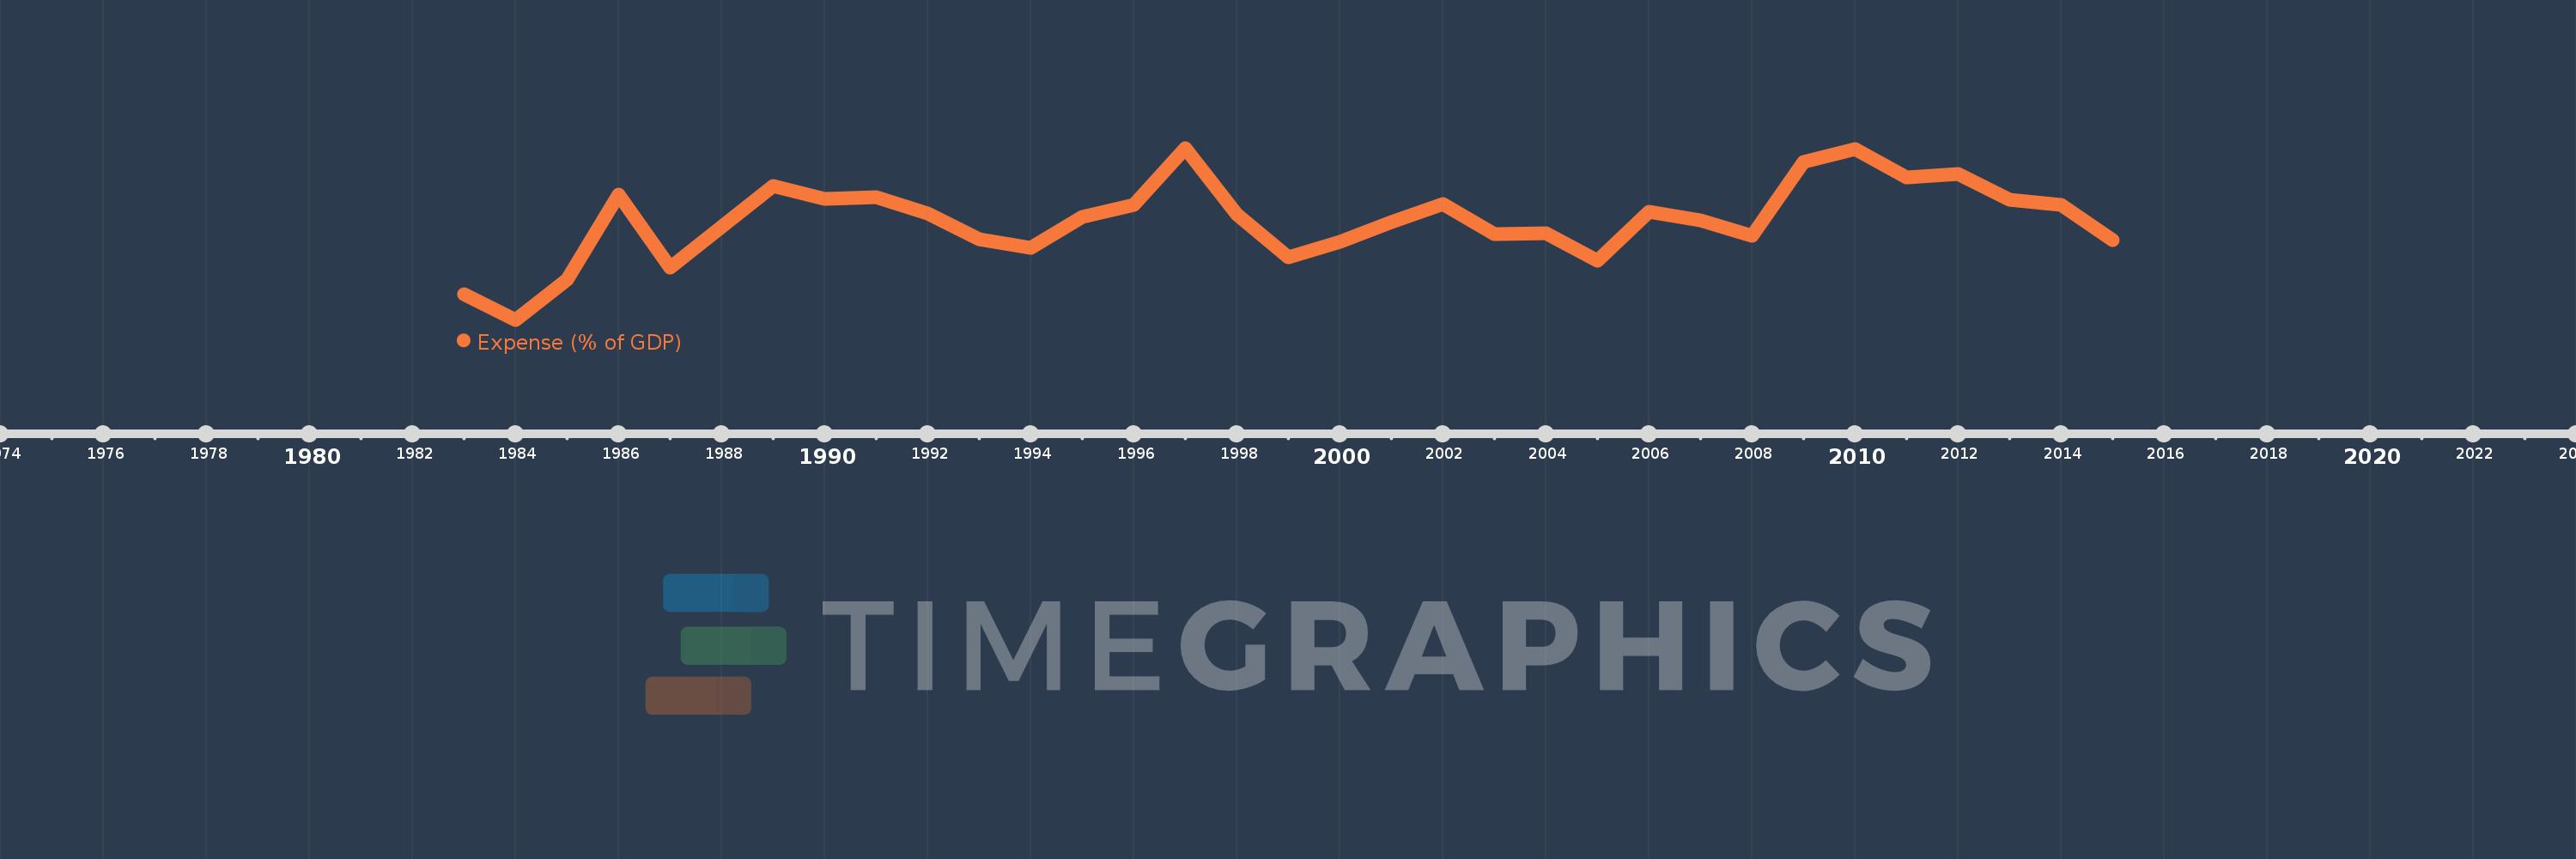
Expense (% of GDP)
2015,2014,2013,2012,2011,2010,2009,2008,2007,2006,2005,2004,2003,2002,2001,2000,1999,1998,1997,1996,1995,1994,1993,1992,1991,1990,1989,1987,1986,1985,1984,1983
This statistics in other country:
AfghanistanAlbaniaAlgeriaAngolaAntigua and BarbudaArmeniaAustraliaAustriaAzerbaijanBahamas, TheBahrainBangladeshBarbadosBelarusBelgiumBelizeBeninBhutanBoliviaBosnia and HerzegovinaBotswanaBrazilBulgariaBurkina FasoBurundiCabo VerdeCambodiaCanadaCaribbean small statesCentral African RepublicCentral Europe and the BalticsChileColombiaCongo, Dem. Rep.Congo, Rep.Costa RicaCote d'IvoireCroatiaCyprusCzech RepublicDenmarkDominicaDominican RepublicEarly-demographic dividendEgypt, Arab Rep.El SalvadorEquatorial GuineaEstoniaEthiopiaEuro areaEurope & Central AsiaEurope & Central Asia (excluding high income)Europe & Central Asia (IDA & IBRD countries)European UnionFijiFinlandFranceGambia, TheGeorgiaGermanyGhanaGreeceGrenadaGuatemalaHeavily indebted poor countries (HIPC)High incomeHondurasHong Kong SAR, ChinaHungaryIcelandIDA blendIDA onlyIDA totalIndiaIndonesiaIran, Islamic Rep.IraqIrelandIsraelItalyJamaicaJapanJordanKazakhstanKenyaKiribatiKorea, Rep.KuwaitKyrgyz RepublicLao PDRLatin America & Caribbean Latin America & Caribbean (excluding high income)Latin America & the Caribbean (IDA & IBRD countries)LatviaLeast developed countries: UN classificationLebanonLesothoLiberiaLithuaniaLow incomeLower middle incomeLuxembourgMacao SAR, ChinaMacedonia, FYRMadagascarMalawiMalaysiaMaldivesMaliMaltaMauritiusMexicoMicronesia, Fed. Sts.Middle East & North Africa (excluding high income)Middle East & North Africa (IDA & IBRD countries)MoldovaMongoliaMoroccoMozambiqueMyanmarNamibiaNepalNetherlandsNew ZealandNicaraguaNigeriaNorth AmericaNorwayOECD membersOmanOther small statesPacific island small statesPakistanPanamaPapua New GuineaParaguayPeruPhilippinesPolandPortugalPost-demographic dividendPre-demographic dividendQatarRomaniaRussian FederationRwandaSamoaSan MarinoSao Tome and PrincipeSenegalSerbiaSeychellesSierra LeoneSingaporeSlovak RepublicSloveniaSmall statesSolomon IslandsSouth AfricaSouth AsiaSouth Asia (IDA & IBRD)SpainSri LankaSt. Kitts and NevisSt. LuciaSub-Saharan Africa Sub-Saharan Africa (excluding high income)Sub-Saharan Africa (IDA & IBRD countries)SurinameSwazilandSwedenSwitzerlandSyrian Arab RepublicTajikistanTanzaniaThailandTimor-LesteTogoTrinidad and TobagoTunisiaTurkeyUgandaUkraineUnited Arab EmiratesUnited KingdomUnited StatesUruguayVanuatuVenezuela, RBVietnamWest Bank and GazaWorldYemen, Rep.ZambiaZimbabwe Timeline:
This timeline shows a graph from 1983 to 2015 of Bhutan. No data until 1982. Number of actual observations by date: 32.
Source name:
World Development Indicators
Source organization:
International Monetary Fund, Government Finance Statistics Yearbook and data files, and World Bank and OECD GDP estimates.
Categories, topics:
Economy & Growth, Public Sector
Last updated:
apr 23, 2017
Indicators value changes by year
Minimum:
13.699
jan 1, 1984
Maximum:
23.338
jan 1, 1997
At the date of observation
Value
Absolute change
Change from previous value
jan 1, 1983
15.118
+15.118
0.0%
jan 1, 1984
13.699
-1.419
-9.39%
jan 1, 1985
15.971
+2.272
16.59%
jan 1, 1986
20.724
+4.753
29.76%
jan 1, 1987
16.642
-4.082
-19.7%
jan 1, 1989
21.201
+4.559
27.39%
jan 1, 1990
20.464
-0.737
-3.48%
jan 1, 1991
20.557
+0.093
0.46%
jan 1, 1992
19.65
-0.907
-4.41%
jan 1, 1993
18.197
-1.453
-7.39%
jan 1, 1994
17.735
-0.462
-2.54%
jan 1, 1995
19.464
+1.73
9.75%
jan 1, 1996
20.158
+0.693
3.56%
jan 1, 1997
23.338
+3.181
15.78%
jan 1, 1998
19.624
-3.714
-15.91%
jan 1, 1999
17.199
-2.425
-12.36%
jan 1, 2000
18.093
+0.894
5.2%
jan 1, 2001
19.186
+1.093
6.04%
jan 1, 2002
20.185
+0.999
5.21%
jan 1, 2003
18.49
-1.694
-8.39%
jan 1, 2004
18.545
+0.055
0.3%
jan 1, 2005
16.986
-1.559
-8.41%
jan 1, 2006
19.756
+2.77
16.31%
jan 1, 2007
19.298
-0.458
-2.32%
jan 1, 2008
18.384
-0.914
-4.74%
jan 1, 2009
22.564
+4.18
22.74%
jan 1, 2010
23.288
+0.724
3.21%
jan 1, 2011
21.704
-1.584
-6.8%
jan 1, 2012
21.859
+0.155
0.71%
jan 1, 2013
20.436
-1.423
-6.51%
jan 1, 2014
20.142
-0.294
-1.44%
jan 1, 2015
18.165
-1.977
-9.82%
Ranking of countries by current statistics by years


Comments: