29
/
en
AIzaSyAYiBZKx7MnpbEhh9jyipgxe19OcubqV5w
April 1, 2024
247479
Spain
ESP
true
2
1
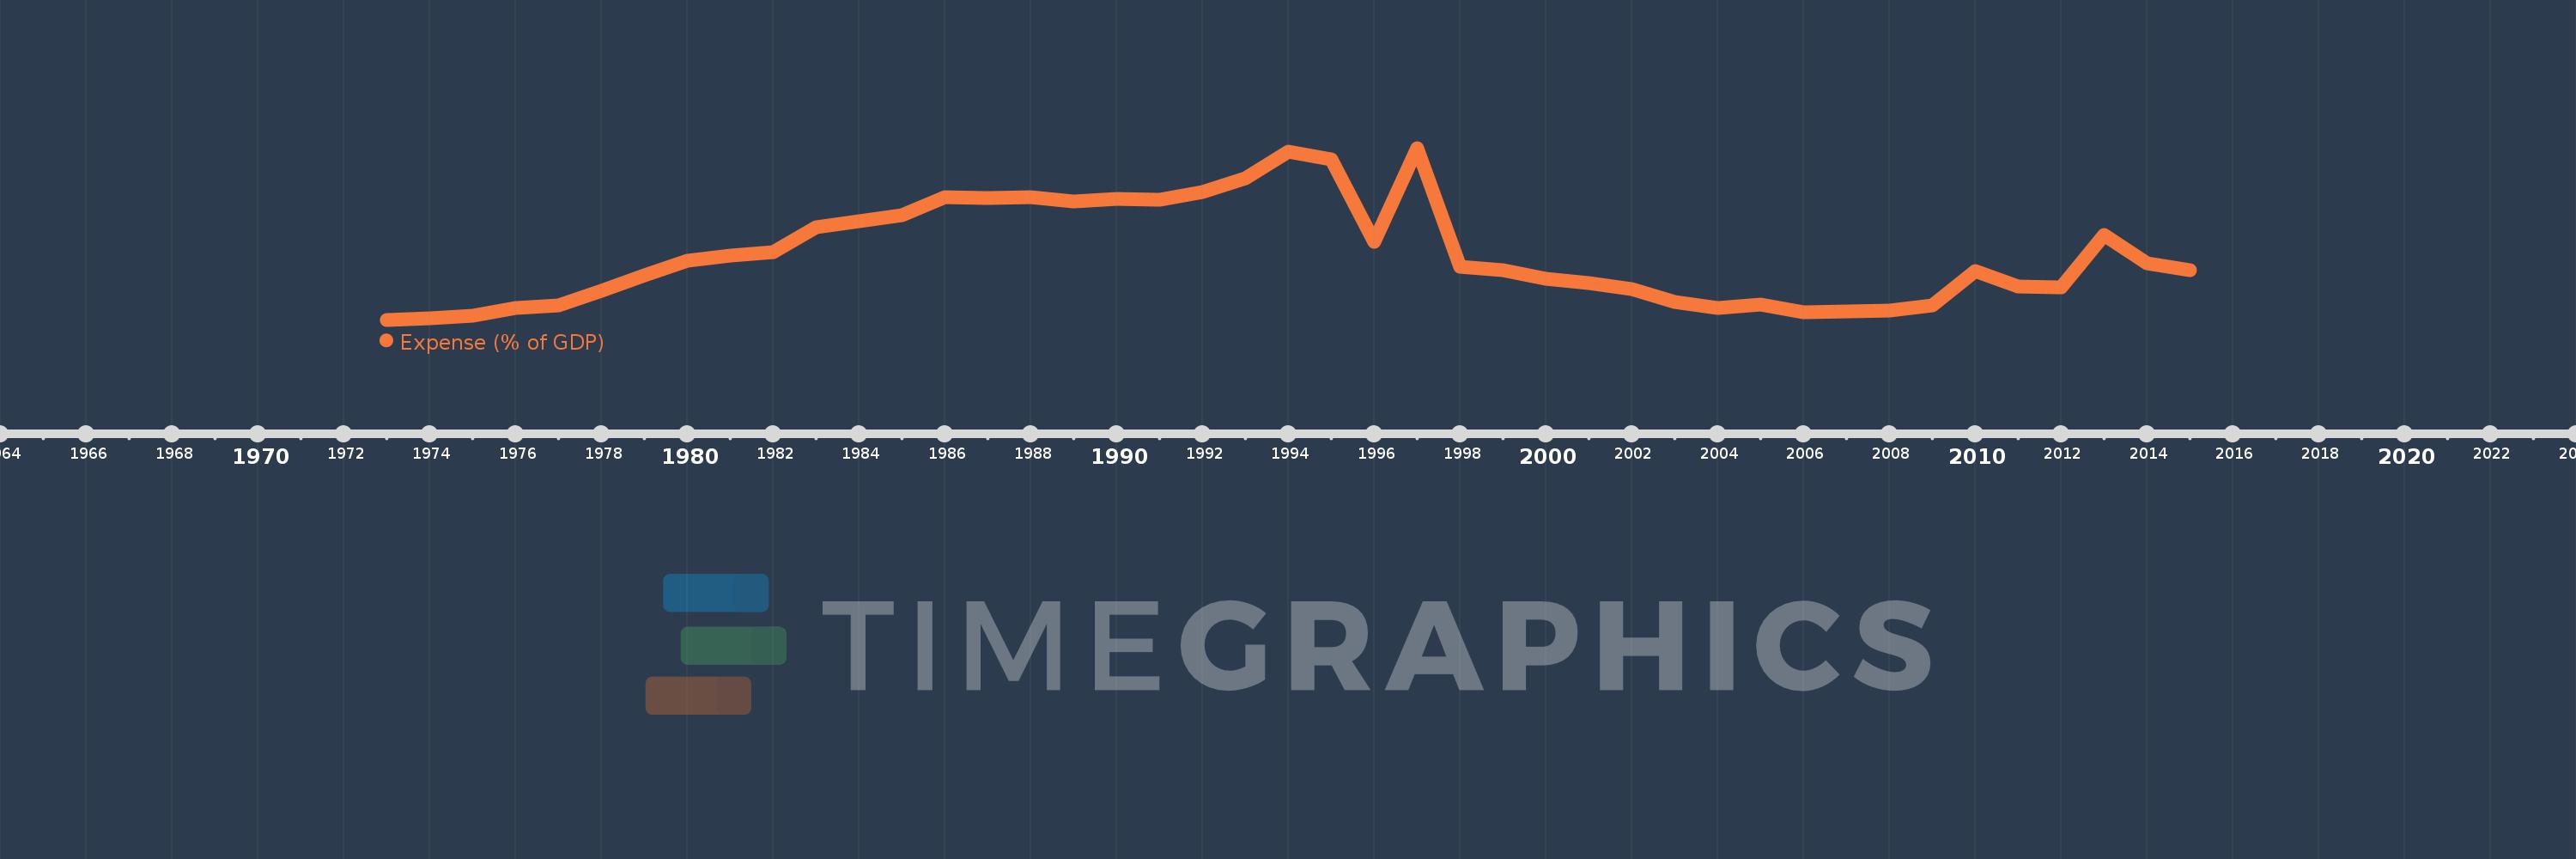
Expense (% of GDP)
2015,2014,2013,2012,2011,2010,2009,2008,2007,2006,2005,2004,2003,2002,2001,2000,1999,1998,1997,1996,1995,1994,1993,1992,1991,1990,1989,1988,1987,1986,1985,1984,1983,1982,1981,1980,1979,1978,1977,1976,1975,1974,1973
This statistics in other country:
AfghanistanAlbaniaAlgeriaAngolaAntigua and BarbudaArmeniaAustraliaAustriaAzerbaijanBahamas, TheBahrainBangladeshBarbadosBelarusBelgiumBelizeBeninBhutanBoliviaBosnia and HerzegovinaBotswanaBrazilBulgariaBurkina FasoBurundiCabo VerdeCambodiaCanadaCaribbean small statesCentral African RepublicCentral Europe and the BalticsChileColombiaCongo, Dem. Rep.Congo, Rep.Costa RicaCote d'IvoireCroatiaCyprusCzech RepublicDenmarkDominicaDominican RepublicEarly-demographic dividendEgypt, Arab Rep.El SalvadorEquatorial GuineaEstoniaEthiopiaEuro areaEurope & Central AsiaEurope & Central Asia (excluding high income)Europe & Central Asia (IDA & IBRD countries)European UnionFijiFinlandFranceGambia, TheGeorgiaGermanyGhanaGreeceGrenadaGuatemalaHeavily indebted poor countries (HIPC)High incomeHondurasHong Kong SAR, ChinaHungaryIcelandIDA blendIDA onlyIDA totalIndiaIndonesiaIran, Islamic Rep.IraqIrelandIsraelItalyJamaicaJapanJordanKazakhstanKenyaKiribatiKorea, Rep.KuwaitKyrgyz RepublicLao PDRLatin America & Caribbean Latin America & Caribbean (excluding high income)Latin America & the Caribbean (IDA & IBRD countries)LatviaLeast developed countries: UN classificationLebanonLesothoLiberiaLithuaniaLow incomeLower middle incomeLuxembourgMacao SAR, ChinaMacedonia, FYRMadagascarMalawiMalaysiaMaldivesMaliMaltaMauritiusMexicoMicronesia, Fed. Sts.Middle East & North Africa (excluding high income)Middle East & North Africa (IDA & IBRD countries)MoldovaMongoliaMoroccoMozambiqueMyanmarNamibiaNepalNetherlandsNew ZealandNicaraguaNigeriaNorth AmericaNorwayOECD membersOmanOther small statesPacific island small statesPakistanPanamaPapua New GuineaParaguayPeruPhilippinesPolandPortugalPost-demographic dividendPre-demographic dividendQatarRomaniaRussian FederationRwandaSamoaSan MarinoSao Tome and PrincipeSenegalSerbiaSeychellesSierra LeoneSingaporeSlovak RepublicSloveniaSmall statesSolomon IslandsSouth AfricaSouth AsiaSouth Asia (IDA & IBRD)SpainSri LankaSt. Kitts and NevisSt. LuciaSub-Saharan Africa Sub-Saharan Africa (excluding high income)Sub-Saharan Africa (IDA & IBRD countries)SurinameSwazilandSwedenSwitzerlandSyrian Arab RepublicTajikistanTanzaniaThailandTimor-LesteTogoTrinidad and TobagoTunisiaTurkeyUgandaUkraineUnited Arab EmiratesUnited KingdomUnited StatesUruguayVanuatuVenezuela, RBVietnamWest Bank and GazaWorldYemen, Rep.ZambiaZimbabwe Timeline:
This timeline shows a graph from 1973 to 2015 of Spain. No data until 1972. Number of actual observations by date: 43.
Source name:
World Development Indicators
Source organization:
International Monetary Fund, Government Finance Statistics Yearbook and data files, and World Bank and OECD GDP estimates.
Categories, topics:
Economy & Growth, Public Sector
Last updated:
apr 23, 2017
Indicators value changes by year
Maximum:
35.143
jan 1, 1997
At the date of observation
Value
Absolute change
Change from previous value
jan 1, 1973
16.04
+16.04
0.0%
jan 1, 1974
16.237
+0.197
1.23%
jan 1, 1975
16.442
+0.205
1.26%
jan 1, 1976
17.336
+0.894
5.44%
jan 1, 1977
17.639
+0.303
1.75%
jan 1, 1978
19.235
+1.596
9.05%
jan 1, 1979
21.008
+1.774
9.22%
jan 1, 1980
22.588
+1.58
7.52%
jan 1, 1981
23.154
+0.566
2.5%
jan 1, 1982
23.525
+0.372
1.6%
jan 1, 1983
26.348
+2.823
12.0%
jan 1, 1984
27.001
+0.653
2.48%
jan 1, 1985
27.691
+0.69
2.55%
jan 1, 1986
29.703
+2.012
7.27%
jan 1, 1987
29.604
-0.098
-0.33%
jan 1, 1988
29.646
+0.042
0.14%
jan 1, 1989
29.18
-0.466
-1.57%
jan 1, 1990
29.481
+0.301
1.03%
jan 1, 1991
29.412
-0.068
-0.23%
jan 1, 1992
30.237
+0.825
2.8%
jan 1, 1993
31.797
+1.56
5.16%
jan 1, 1994
34.725
+2.928
9.21%
jan 1, 1995
33.857
-0.868
-2.5%
jan 1, 1996
24.701
-9.156
-27.04%
jan 1, 1997
35.143
+10.442
42.27%
jan 1, 1998
21.976
-13.167
-37.47%
jan 1, 1999
21.567
-0.41
-1.87%
jan 1, 2000
20.61
-0.957
-4.44%
jan 1, 2001
20.151
-0.459
-2.23%
jan 1, 2002
19.491
-0.66
-3.27%
jan 1, 2003
17.987
-1.504
-7.72%
jan 1, 2004
17.391
-0.597
-3.32%
jan 1, 2005
17.729
+0.338
1.94%
jan 1, 2006
16.888
-0.841
-4.74%
jan 1, 2007
16.995
+0.107
0.63%
jan 1, 2008
17.057
+0.062
0.36%
jan 1, 2009
17.623
+0.566
3.32%
jan 1, 2010
21.418
+3.795
21.54%
jan 1, 2011
19.771
-1.647
-7.69%
jan 1, 2012
19.661
-0.11
-0.56%
jan 1, 2013
25.48
+5.818
29.59%
jan 1, 2014
22.334
-3.146
-12.35%
jan 1, 2015
21.579
-0.755
-3.38%
Ranking of countries by current statistics by years


Comments: