29
/
en
AIzaSyAYiBZKx7MnpbEhh9jyipgxe19OcubqV5w
April 1, 2024
256268
Sweden
SWE
true
2
1
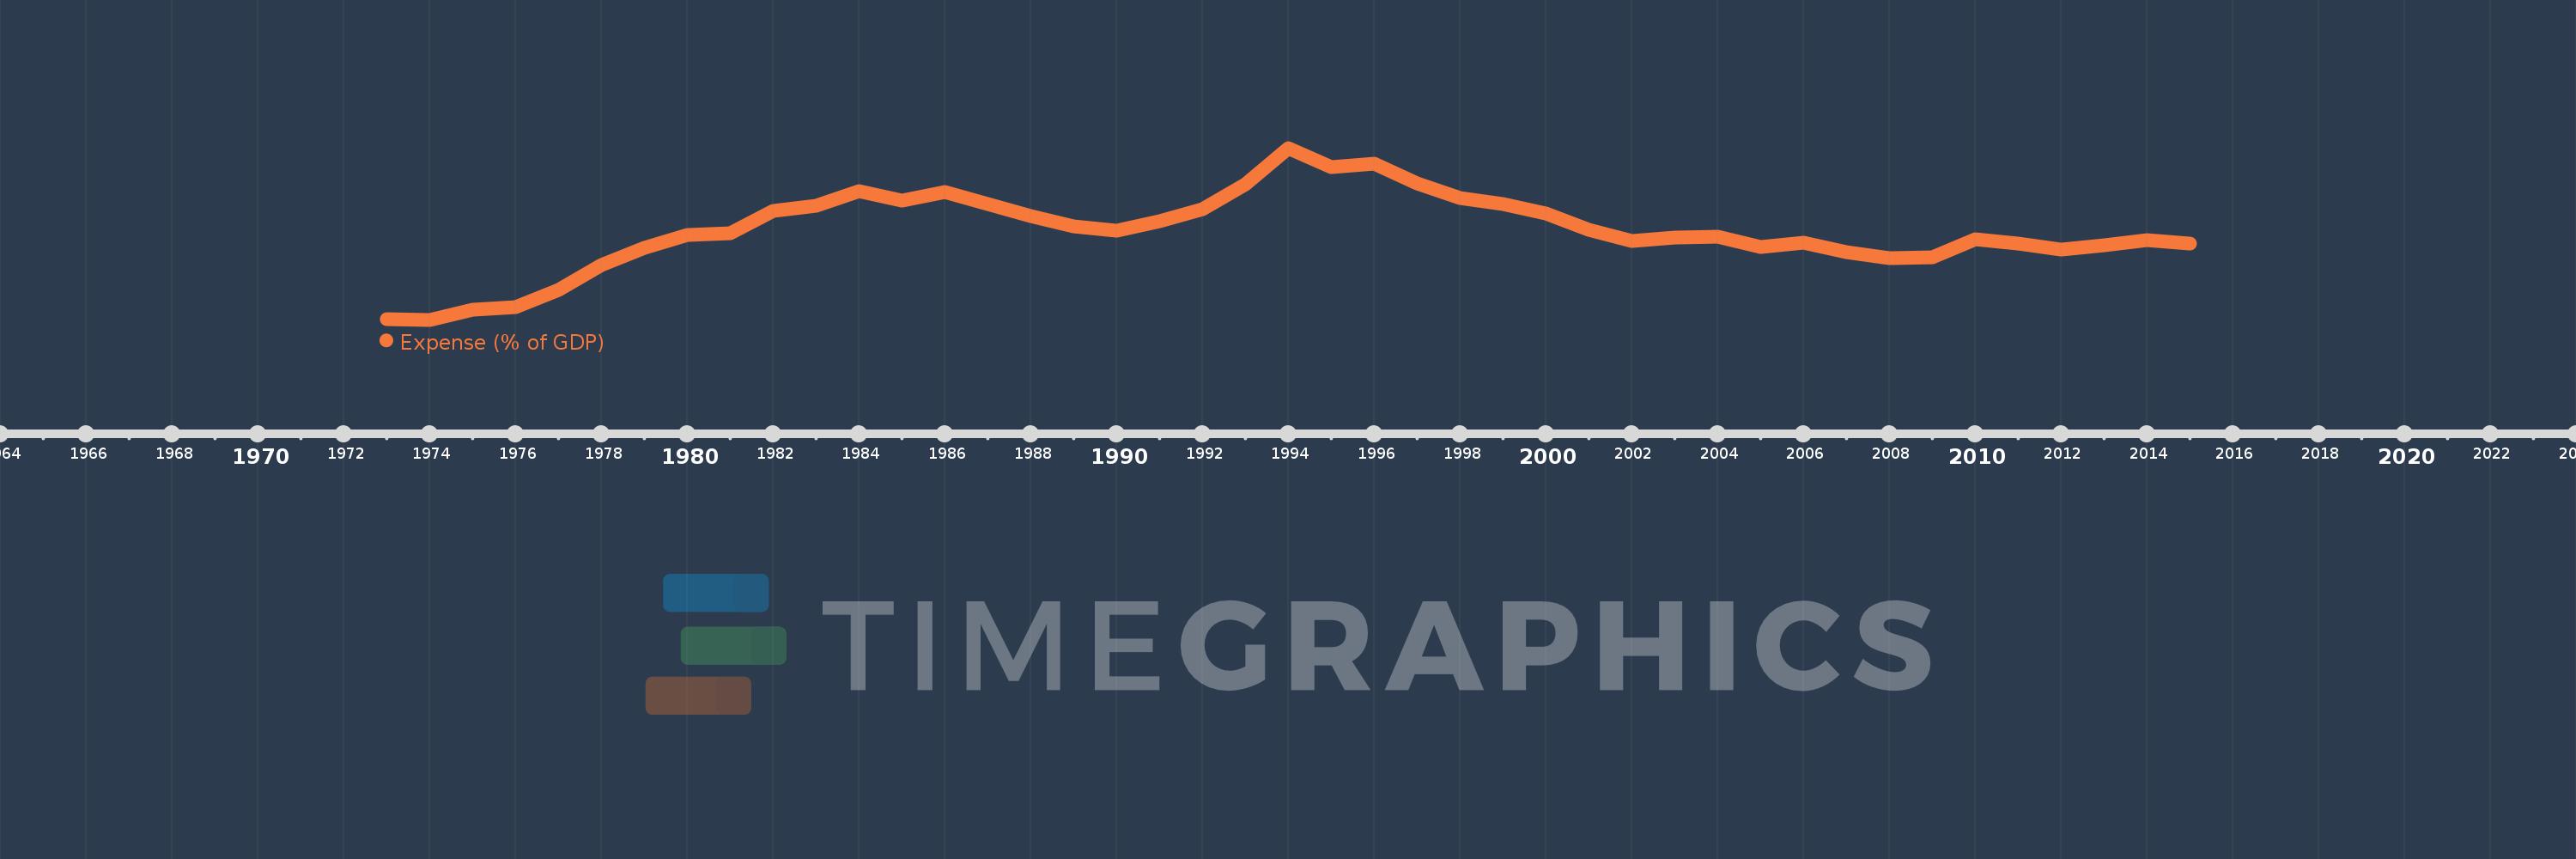
Expense (% of GDP)
2015,2014,2013,2012,2011,2010,2009,2008,2007,2006,2005,2004,2003,2002,2001,2000,1999,1998,1997,1996,1995,1994,1993,1992,1991,1990,1989,1988,1987,1986,1985,1984,1983,1982,1981,1980,1979,1978,1977,1976,1975,1974,1973
This statistics in other country:
AfghanistanAlbaniaAlgeriaAngolaAntigua and BarbudaArmeniaAustraliaAustriaAzerbaijanBahamas, TheBahrainBangladeshBarbadosBelarusBelgiumBelizeBeninBhutanBoliviaBosnia and HerzegovinaBotswanaBrazilBulgariaBurkina FasoBurundiCabo VerdeCambodiaCanadaCaribbean small statesCentral African RepublicCentral Europe and the BalticsChileColombiaCongo, Dem. Rep.Congo, Rep.Costa RicaCote d'IvoireCroatiaCyprusCzech RepublicDenmarkDominicaDominican RepublicEarly-demographic dividendEgypt, Arab Rep.El SalvadorEquatorial GuineaEstoniaEthiopiaEuro areaEurope & Central AsiaEurope & Central Asia (excluding high income)Europe & Central Asia (IDA & IBRD countries)European UnionFijiFinlandFranceGambia, TheGeorgiaGermanyGhanaGreeceGrenadaGuatemalaHeavily indebted poor countries (HIPC)High incomeHondurasHong Kong SAR, ChinaHungaryIcelandIDA blendIDA onlyIDA totalIndiaIndonesiaIran, Islamic Rep.IraqIrelandIsraelItalyJamaicaJapanJordanKazakhstanKenyaKiribatiKorea, Rep.KuwaitKyrgyz RepublicLao PDRLatin America & Caribbean Latin America & Caribbean (excluding high income)Latin America & the Caribbean (IDA & IBRD countries)LatviaLeast developed countries: UN classificationLebanonLesothoLiberiaLithuaniaLow incomeLower middle incomeLuxembourgMacao SAR, ChinaMacedonia, FYRMadagascarMalawiMalaysiaMaldivesMaliMaltaMauritiusMexicoMicronesia, Fed. Sts.Middle East & North Africa (excluding high income)Middle East & North Africa (IDA & IBRD countries)MoldovaMongoliaMoroccoMozambiqueMyanmarNamibiaNepalNetherlandsNew ZealandNicaraguaNigeriaNorth AmericaNorwayOECD membersOmanOther small statesPacific island small statesPakistanPanamaPapua New GuineaParaguayPeruPhilippinesPolandPortugalPost-demographic dividendPre-demographic dividendQatarRomaniaRussian FederationRwandaSamoaSan MarinoSao Tome and PrincipeSenegalSerbiaSeychellesSierra LeoneSingaporeSlovak RepublicSloveniaSmall statesSolomon IslandsSouth AfricaSouth AsiaSouth Asia (IDA & IBRD)SpainSri LankaSt. Kitts and NevisSt. LuciaSub-Saharan Africa Sub-Saharan Africa (excluding high income)Sub-Saharan Africa (IDA & IBRD countries)SurinameSwazilandSwedenSwitzerlandSyrian Arab RepublicTajikistanTanzaniaThailandTimor-LesteTogoTrinidad and TobagoTunisiaTurkeyUgandaUkraineUnited Arab EmiratesUnited KingdomUnited StatesUruguayVanuatuVenezuela, RBVietnamWest Bank and GazaWorldYemen, Rep.ZambiaZimbabwe Timeline:
This timeline shows a graph from 1973 to 2015 of Sweden. No data until 1972. Number of actual observations by date: 43.
Source name:
World Development Indicators
Source organization:
International Monetary Fund, Government Finance Statistics Yearbook and data files, and World Bank and OECD GDP estimates.
Categories, topics:
Economy & Growth, Public Sector
Last updated:
apr 23, 2017
Indicators value changes by year
Minimum:
23.278
jan 1, 1974
Maximum:
44.849
jan 1, 1994
At the date of observation
Value
Absolute change
Change from previous value
jan 1, 1973
23.337
+23.337
0.0%
jan 1, 1974
23.278
-0.059
-0.25%
jan 1, 1975
24.515
+1.237
5.31%
jan 1, 1976
24.874
+0.36
1.47%
jan 1, 1977
27.027
+2.153
8.65%
jan 1, 1978
30.132
+3.105
11.49%
jan 1, 1979
32.334
+2.202
7.31%
jan 1, 1980
33.955
+1.621
5.01%
jan 1, 1981
34.164
+0.209
0.62%
jan 1, 1982
36.956
+2.791
8.17%
jan 1, 1983
37.632
+0.676
1.83%
jan 1, 1984
39.449
+1.818
4.83%
jan 1, 1985
38.222
-1.227
-3.11%
jan 1, 1986
39.36
+1.138
2.98%
jan 1, 1987
37.852
-1.509
-3.83%
jan 1, 1988
36.253
-1.599
-4.22%
jan 1, 1989
35.028
-1.225
-3.38%
jan 1, 1990
34.473
-0.555
-1.58%
jan 1, 1991
35.677
+1.204
3.49%
jan 1, 1992
37.152
+1.475
4.13%
jan 1, 1993
40.275
+3.124
8.41%
jan 1, 1994
44.849
+4.573
11.36%
jan 1, 1995
42.496
-2.353
-5.25%
jan 1, 1996
42.861
+0.364
0.86%
jan 1, 1997
40.372
-2.489
-5.81%
jan 1, 1998
38.589
-1.783
-4.42%
jan 1, 1999
37.831
-0.758
-1.96%
jan 1, 2000
36.619
-1.212
-3.2%
jan 1, 2001
34.556
-2.063
-5.63%
jan 1, 2002
33.196
-1.359
-3.93%
jan 1, 2003
33.647
+0.451
1.36%
jan 1, 2004
33.666
+0.019
0.06%
jan 1, 2005
32.463
-1.202
-3.57%
jan 1, 2006
32.966
+0.503
1.55%
jan 1, 2007
31.742
-1.225
-3.71%
jan 1, 2008
31.06
-0.682
-2.15%
jan 1, 2009
31.085
+0.025
0.08%
jan 1, 2010
33.399
+2.314
7.44%
jan 1, 2011
32.807
-0.592
-1.77%
jan 1, 2012
32.074
-0.732
-2.23%
jan 1, 2013
32.589
+0.515
1.6%
jan 1, 2014
33.329
+0.74
2.27%
jan 1, 2015
32.893
-0.436
-1.31%
Ranking of countries by current statistics by years


Comments: