29
/
en
AIzaSyAYiBZKx7MnpbEhh9jyipgxe19OcubqV5w
April 1, 2024
240394
Singapore
SGP
true
2
1
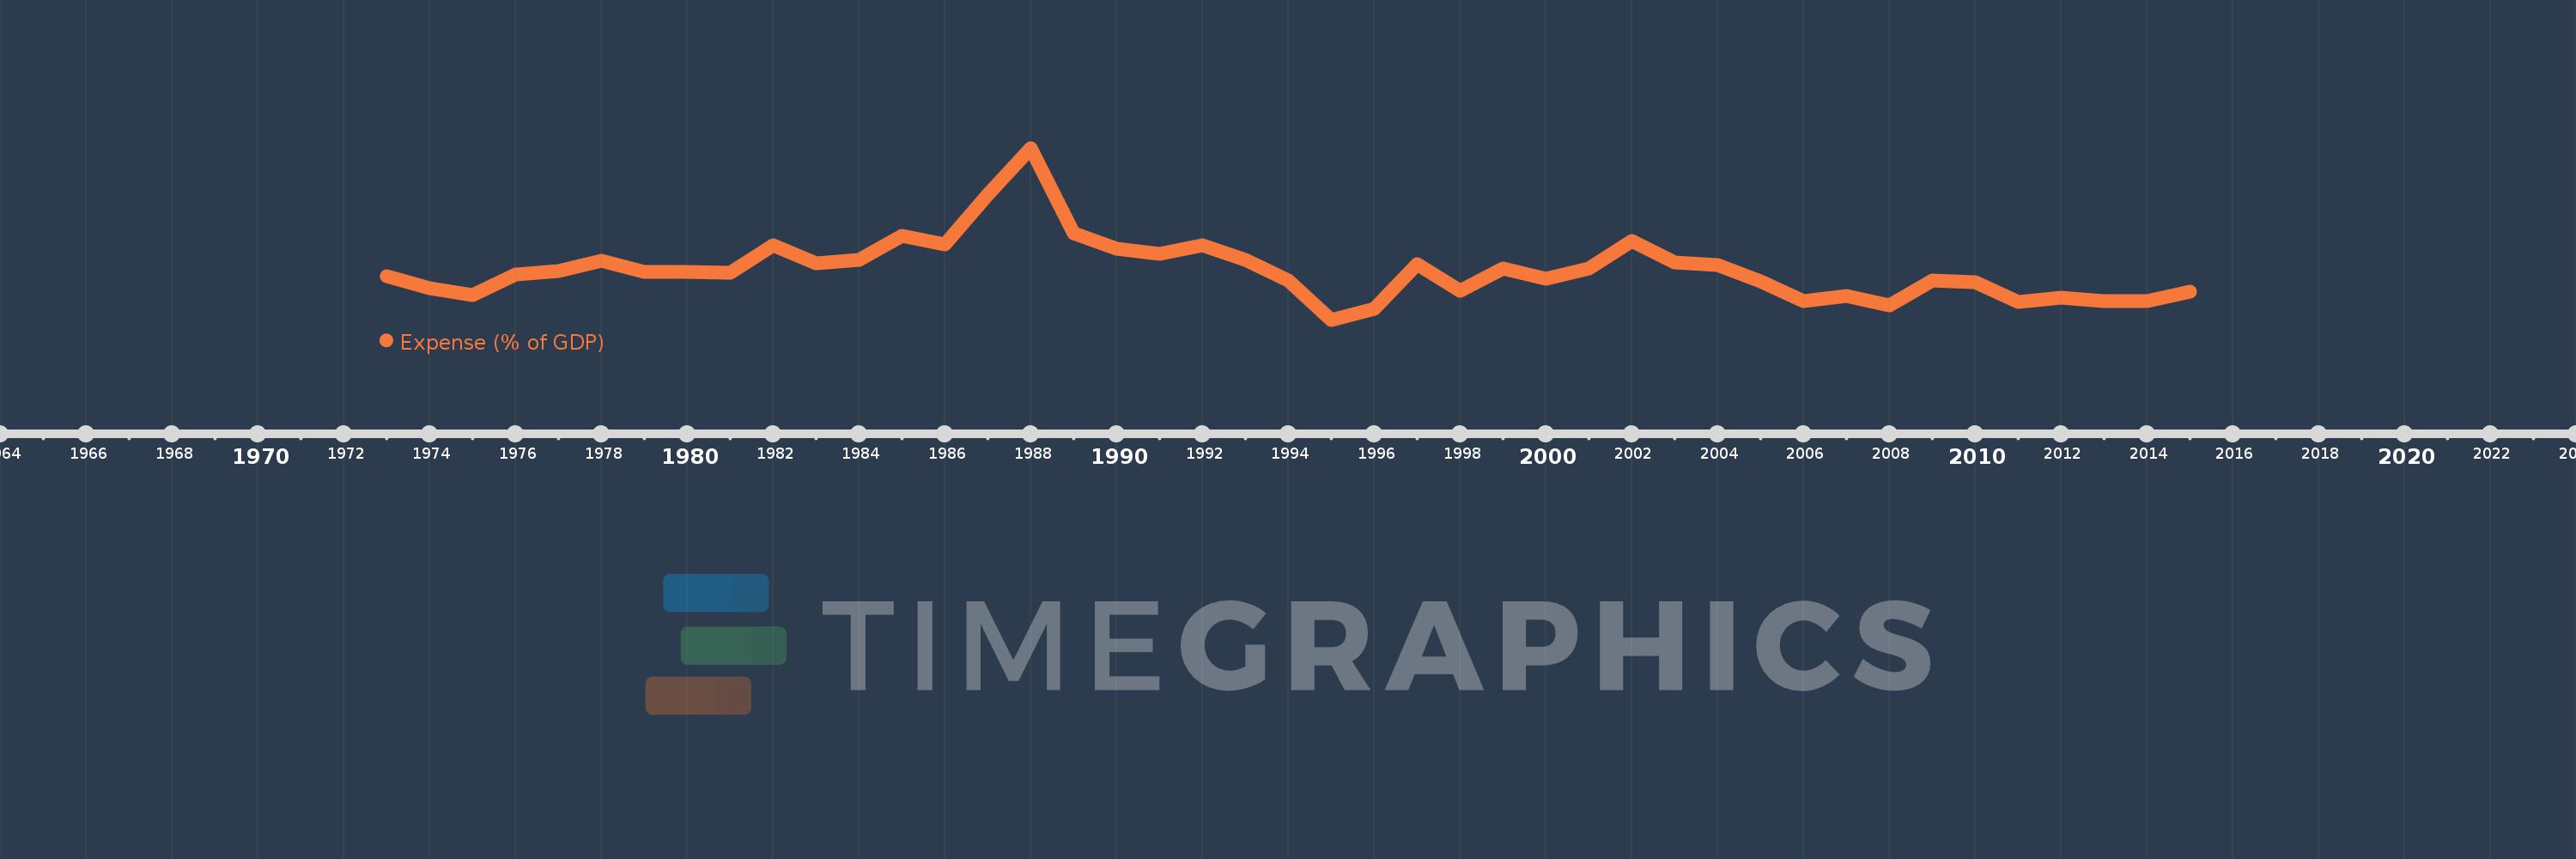
Expense (% of GDP)
2015,2014,2013,2012,2011,2010,2009,2008,2007,2006,2005,2004,2003,2002,2001,2000,1999,1998,1997,1996,1995,1994,1993,1992,1991,1990,1989,1988,1987,1986,1985,1984,1983,1982,1981,1980,1979,1978,1977,1976,1975,1974,1973
This statistics in other country:
AfghanistanAlbaniaAlgeriaAngolaAntigua and BarbudaArmeniaAustraliaAustriaAzerbaijanBahamas, TheBahrainBangladeshBarbadosBelarusBelgiumBelizeBeninBhutanBoliviaBosnia and HerzegovinaBotswanaBrazilBulgariaBurkina FasoBurundiCabo VerdeCambodiaCanadaCaribbean small statesCentral African RepublicCentral Europe and the BalticsChileColombiaCongo, Dem. Rep.Congo, Rep.Costa RicaCote d'IvoireCroatiaCyprusCzech RepublicDenmarkDominicaDominican RepublicEarly-demographic dividendEgypt, Arab Rep.El SalvadorEquatorial GuineaEstoniaEthiopiaEuro areaEurope & Central AsiaEurope & Central Asia (excluding high income)Europe & Central Asia (IDA & IBRD countries)European UnionFijiFinlandFranceGambia, TheGeorgiaGermanyGhanaGreeceGrenadaGuatemalaHeavily indebted poor countries (HIPC)High incomeHondurasHong Kong SAR, ChinaHungaryIcelandIDA blendIDA onlyIDA totalIndiaIndonesiaIran, Islamic Rep.IraqIrelandIsraelItalyJamaicaJapanJordanKazakhstanKenyaKiribatiKorea, Rep.KuwaitKyrgyz RepublicLao PDRLatin America & Caribbean Latin America & Caribbean (excluding high income)Latin America & the Caribbean (IDA & IBRD countries)LatviaLeast developed countries: UN classificationLebanonLesothoLiberiaLithuaniaLow incomeLower middle incomeLuxembourgMacao SAR, ChinaMacedonia, FYRMadagascarMalawiMalaysiaMaldivesMaliMaltaMauritiusMexicoMicronesia, Fed. Sts.Middle East & North Africa (excluding high income)Middle East & North Africa (IDA & IBRD countries)MoldovaMongoliaMoroccoMozambiqueMyanmarNamibiaNepalNetherlandsNew ZealandNicaraguaNigeriaNorth AmericaNorwayOECD membersOmanOther small statesPacific island small statesPakistanPanamaPapua New GuineaParaguayPeruPhilippinesPolandPortugalPost-demographic dividendPre-demographic dividendQatarRomaniaRussian FederationRwandaSamoaSan MarinoSao Tome and PrincipeSenegalSerbiaSeychellesSierra LeoneSingaporeSlovak RepublicSloveniaSmall statesSolomon IslandsSouth AfricaSouth AsiaSouth Asia (IDA & IBRD)SpainSri LankaSt. Kitts and NevisSt. LuciaSub-Saharan Africa Sub-Saharan Africa (excluding high income)Sub-Saharan Africa (IDA & IBRD countries)SurinameSwazilandSwedenSwitzerlandSyrian Arab RepublicTajikistanTanzaniaThailandTimor-LesteTogoTrinidad and TobagoTunisiaTurkeyUgandaUkraineUnited Arab EmiratesUnited KingdomUnited StatesUruguayVanuatuVenezuela, RBVietnamWest Bank and GazaWorldYemen, Rep.ZambiaZimbabwe Timeline:
This timeline shows a graph from 1973 to 2015 of Singapore. No data until 1972. Number of actual observations by date: 43.
Source name:
World Development Indicators
Source organization:
International Monetary Fund, Government Finance Statistics Yearbook and data files, and World Bank and OECD GDP estimates.
Categories, topics:
Economy & Growth, Public Sector
Last updated:
apr 23, 2017
Indicators value changes by year
Minimum:
10.905
jan 1, 1995
Maximum:
27.031
jan 1, 1988
At the date of observation
Value
Absolute change
Change from previous value
jan 1, 1973
15.004
+15.004
0.0%
jan 1, 1974
13.852
-1.153
-7.68%
jan 1, 1975
13.222
-0.63
-4.55%
jan 1, 1976
15.188
+1.966
14.87%
jan 1, 1977
15.491
+0.303
2.0%
jan 1, 1978
16.415
+0.924
5.96%
jan 1, 1979
15.359
-1.056
-6.43%
jan 1, 1980
15.419
+0.06
0.39%
jan 1, 1981
15.327
-0.093
-0.6%
jan 1, 1982
17.858
+2.531
16.52%
jan 1, 1983
16.182
-1.676
-9.39%
jan 1, 1984
16.517
+0.335
2.07%
jan 1, 1985
18.8
+2.283
13.82%
jan 1, 1986
17.97
-0.83
-4.42%
jan 1, 1987
22.678
+4.708
26.2%
jan 1, 1988
27.031
+4.353
19.2%
jan 1, 1989
19.003
-8.029
-29.7%
jan 1, 1990
17.578
-1.425
-7.5%
jan 1, 1991
17.062
-0.516
-2.93%
jan 1, 1992
17.875
+0.813
4.76%
jan 1, 1993
16.533
-1.342
-7.51%
jan 1, 1994
14.566
-1.967
-11.9%
jan 1, 1995
10.905
-3.661
-25.13%
jan 1, 1996
11.916
+1.01
9.26%
jan 1, 1997
16.147
+4.231
35.51%
jan 1, 1998
13.626
-2.521
-15.61%
jan 1, 1999
15.726
+2.1
15.41%
jan 1, 2000
14.773
-0.953
-6.06%
jan 1, 2001
15.756
+0.984
6.66%
jan 1, 2002
18.273
+2.517
15.97%
jan 1, 2003
16.25
-2.023
-11.07%
jan 1, 2004
16.043
-0.207
-1.28%
jan 1, 2005
14.499
-1.544
-9.63%
jan 1, 2006
12.632
-1.866
-12.87%
jan 1, 2007
13.13
+0.498
3.94%
jan 1, 2008
12.214
-0.917
-6.98%
jan 1, 2009
14.61
+2.396
19.61%
jan 1, 2010
14.434
-0.176
-1.2%
jan 1, 2011
12.591
-1.843
-12.77%
jan 1, 2012
12.964
+0.374
2.97%
jan 1, 2013
12.633
-0.331
-2.56%
jan 1, 2014
12.676
+0.043
0.34%
jan 1, 2015
13.516
+0.841
6.63%
Ranking of countries by current statistics by years


Comments: