29
/
en
AIzaSyAYiBZKx7MnpbEhh9jyipgxe19OcubqV5w
April 1, 2024
155906
Indonesia
IDN
true
2
1
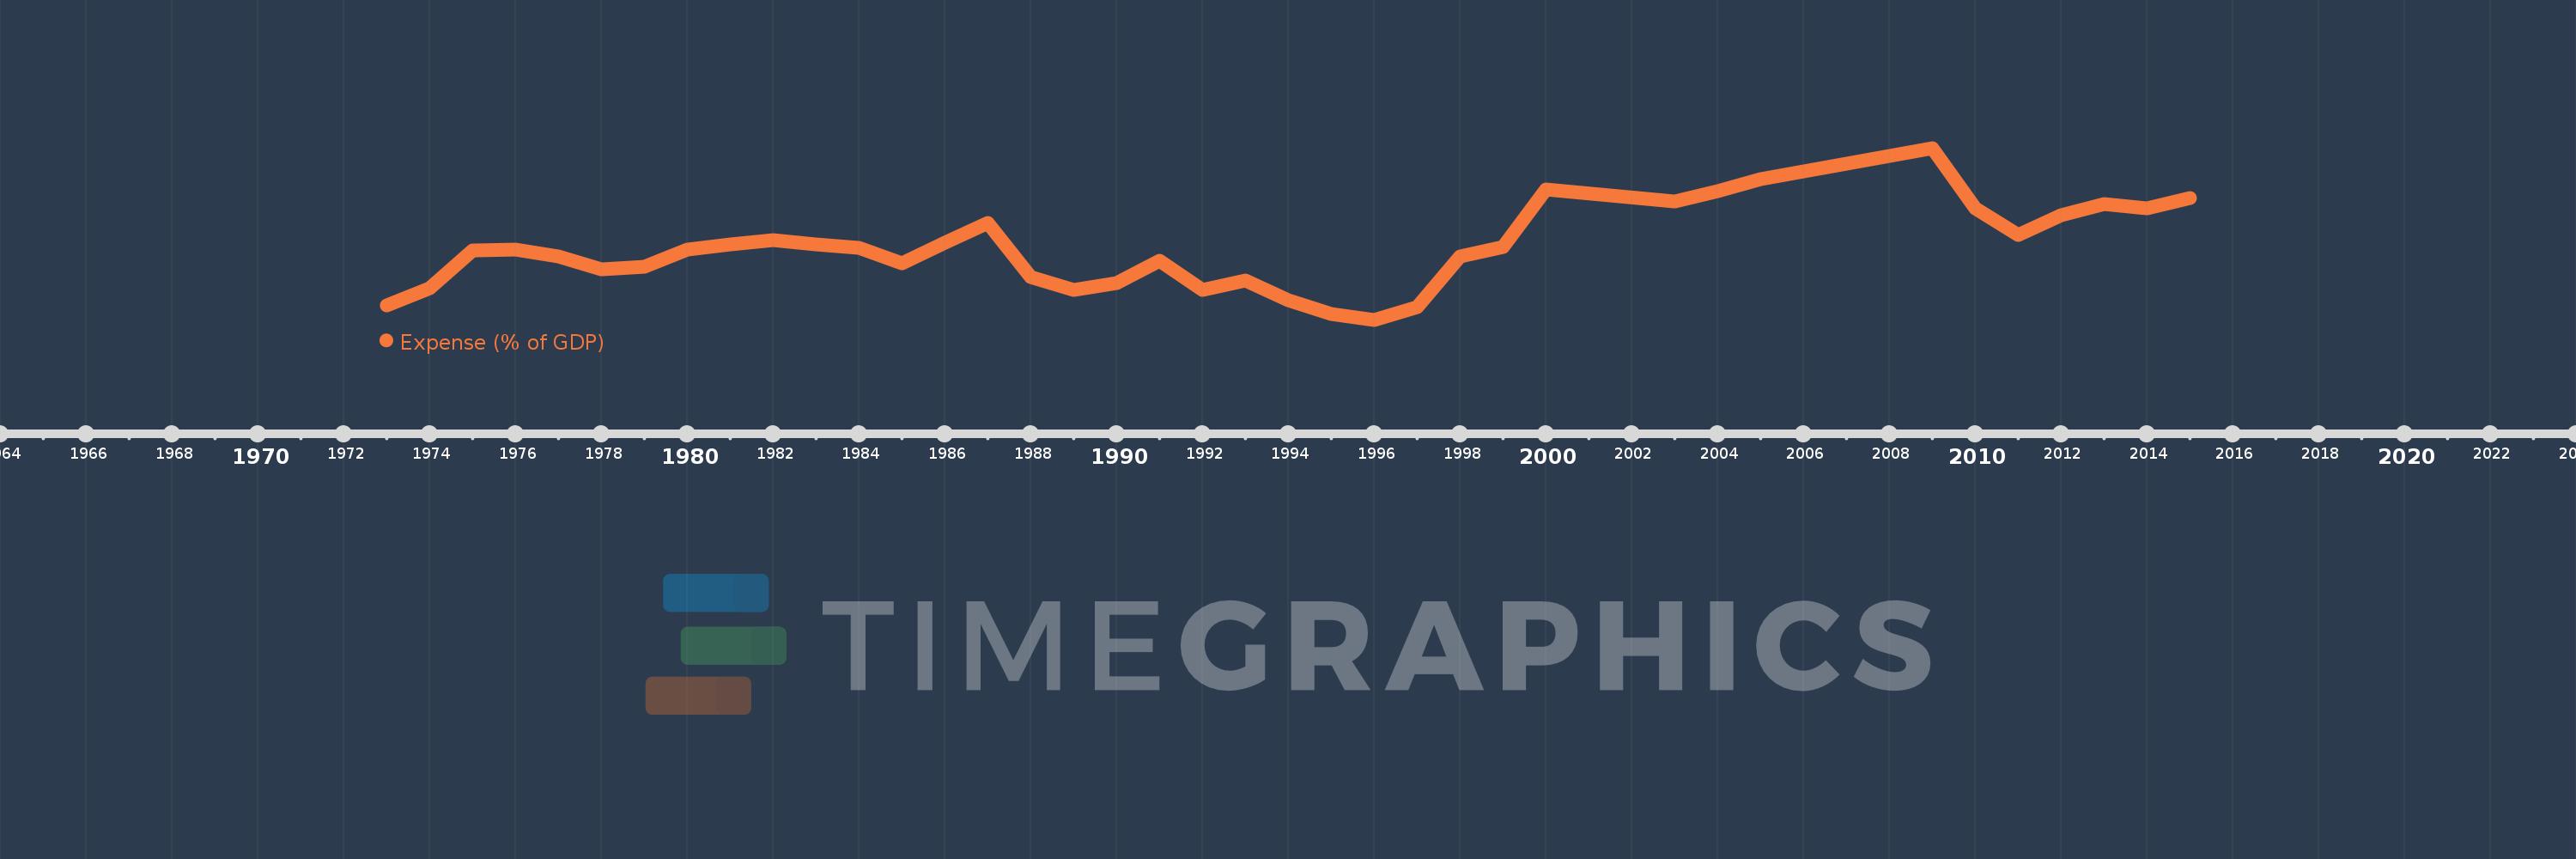
Expense (% of GDP)
2015,2014,2013,2012,2011,2010,2009,2005,2004,2003,2000,1999,1998,1997,1996,1995,1994,1993,1992,1991,1990,1989,1988,1987,1986,1985,1984,1983,1982,1981,1980,1979,1978,1977,1976,1975,1974,1973
This statistics in other country:
AfghanistanAlbaniaAlgeriaAngolaAntigua and BarbudaArmeniaAustraliaAustriaAzerbaijanBahamas, TheBahrainBangladeshBarbadosBelarusBelgiumBelizeBeninBhutanBoliviaBosnia and HerzegovinaBotswanaBrazilBulgariaBurkina FasoBurundiCabo VerdeCambodiaCanadaCaribbean small statesCentral African RepublicCentral Europe and the BalticsChileColombiaCongo, Dem. Rep.Congo, Rep.Costa RicaCote d'IvoireCroatiaCyprusCzech RepublicDenmarkDominicaDominican RepublicEarly-demographic dividendEgypt, Arab Rep.El SalvadorEquatorial GuineaEstoniaEthiopiaEuro areaEurope & Central AsiaEurope & Central Asia (excluding high income)Europe & Central Asia (IDA & IBRD countries)European UnionFijiFinlandFranceGambia, TheGeorgiaGermanyGhanaGreeceGrenadaGuatemalaHeavily indebted poor countries (HIPC)High incomeHondurasHong Kong SAR, ChinaHungaryIcelandIDA blendIDA onlyIDA totalIndiaIndonesiaIran, Islamic Rep.IraqIrelandIsraelItalyJamaicaJapanJordanKazakhstanKenyaKiribatiKorea, Rep.KuwaitKyrgyz RepublicLao PDRLatin America & Caribbean Latin America & Caribbean (excluding high income)Latin America & the Caribbean (IDA & IBRD countries)LatviaLeast developed countries: UN classificationLebanonLesothoLiberiaLithuaniaLow incomeLower middle incomeLuxembourgMacao SAR, ChinaMacedonia, FYRMadagascarMalawiMalaysiaMaldivesMaliMaltaMauritiusMexicoMicronesia, Fed. Sts.Middle East & North Africa (excluding high income)Middle East & North Africa (IDA & IBRD countries)MoldovaMongoliaMoroccoMozambiqueMyanmarNamibiaNepalNetherlandsNew ZealandNicaraguaNigeriaNorth AmericaNorwayOECD membersOmanOther small statesPacific island small statesPakistanPanamaPapua New GuineaParaguayPeruPhilippinesPolandPortugalPost-demographic dividendPre-demographic dividendQatarRomaniaRussian FederationRwandaSamoaSan MarinoSao Tome and PrincipeSenegalSerbiaSeychellesSierra LeoneSingaporeSlovak RepublicSloveniaSmall statesSolomon IslandsSouth AfricaSouth AsiaSouth Asia (IDA & IBRD)SpainSri LankaSt. Kitts and NevisSt. LuciaSub-Saharan Africa Sub-Saharan Africa (excluding high income)Sub-Saharan Africa (IDA & IBRD countries)SurinameSwazilandSwedenSwitzerlandSyrian Arab RepublicTajikistanTanzaniaThailandTimor-LesteTogoTrinidad and TobagoTunisiaTurkeyUgandaUkraineUnited Arab EmiratesUnited KingdomUnited StatesUruguayVanuatuVenezuela, RBVietnamWest Bank and GazaWorldYemen, Rep.ZambiaZimbabwe Timeline:
This timeline shows a graph from 1973 to 2015 of Indonesia. No data until 1972. Number of actual observations by date: 38.
Source name:
World Development Indicators
Source organization:
International Monetary Fund, Government Finance Statistics Yearbook and data files, and World Bank and OECD GDP estimates.
Categories, topics:
Economy & Growth, Public Sector
Last updated:
apr 23, 2017
Indicators value changes by year
Maximum:
18.449
jan 1, 2009
At the date of observation
Value
Absolute change
Change from previous value
jan 1, 1973
10.429
+10.429
0.0%
jan 1, 1974
11.313
+0.883
8.47%
jan 1, 1975
13.233
+1.92
16.97%
jan 1, 1976
13.273
+0.04
0.3%
jan 1, 1977
12.918
-0.355
-2.67%
jan 1, 1978
12.272
-0.646
-5.0%
jan 1, 1979
12.402
+0.13
1.06%
jan 1, 1980
13.268
+0.865
6.98%
jan 1, 1981
13.544
+0.276
2.08%
jan 1, 1982
13.756
+0.212
1.57%
jan 1, 1983
13.56
-0.196
-1.43%
jan 1, 1984
13.379
-0.181
-1.33%
jan 1, 1985
12.584
-0.795
-5.94%
jan 1, 1986
13.65
+1.066
8.47%
jan 1, 1987
14.653
+1.003
7.35%
jan 1, 1988
11.89
-2.763
-18.85%
jan 1, 1989
11.235
-0.656
-5.51%
jan 1, 1990
11.579
+0.344
3.06%
jan 1, 1991
12.721
+1.142
9.86%
jan 1, 1992
11.238
-1.483
-11.66%
jan 1, 1993
11.71
+0.473
4.21%
jan 1, 1994
10.71
-1.001
-8.54%
jan 1, 1995
9.985
-0.725
-6.77%
jan 1, 1996
9.711
-0.274
-2.74%
jan 1, 1997
10.363
+0.652
6.71%
jan 1, 1998
12.92
+2.557
24.67%
jan 1, 1999
13.43
+0.51
3.95%
jan 1, 2000
16.329
+2.9
21.59%
jan 1, 2003
15.713
-0.616
-3.77%
jan 1, 2004
16.258
+0.544
3.47%
jan 1, 2005
16.854
+0.596
3.67%
jan 1, 2009
18.449
+1.595
9.46%
jan 1, 2010
15.367
-3.081
-16.7%
jan 1, 2011
14.012
-1.355
-8.82%
jan 1, 2012
15.025
+1.013
7.23%
jan 1, 2013
15.613
+0.589
3.92%
jan 1, 2014
15.375
-0.238
-1.53%
jan 1, 2015
15.911
+0.536
3.49%
Ranking of countries by current statistics by years


Comments: