29
/
en
AIzaSyAYiBZKx7MnpbEhh9jyipgxe19OcubqV5w
April 1, 2024
245507
South Africa
ZAF
true
2
1
Expense (% of GDP)
2015,2014,2013,2012,2011,2010,2009,2008,2007,2006,2005,2004,2003,2002,2001,2000,1999,1998,1997,1996,1995,1994,1993,1992,1991,1990,1989,1988,1987,1986,1985,1984,1983,1982,1981,1980,1979,1978,1977,1976,1975,1974,1973
This statistics in other country:
AfghanistanAlbaniaAlgeriaAngolaAntigua and BarbudaArmeniaAustraliaAustriaAzerbaijanBahamas, TheBahrainBangladeshBarbadosBelarusBelgiumBelizeBeninBhutanBoliviaBosnia and HerzegovinaBotswanaBrazilBulgariaBurkina FasoBurundiCabo VerdeCambodiaCanadaCaribbean small statesCentral African RepublicCentral Europe and the BalticsChileColombiaCongo, Dem. Rep.Congo, Rep.Costa RicaCote d'IvoireCroatiaCyprusCzech RepublicDenmarkDominicaDominican RepublicEarly-demographic dividendEgypt, Arab Rep.El SalvadorEquatorial GuineaEstoniaEthiopiaEuro areaEurope & Central AsiaEurope & Central Asia (excluding high income)Europe & Central Asia (IDA & IBRD countries)European UnionFijiFinlandFranceGambia, TheGeorgiaGermanyGhanaGreeceGrenadaGuatemalaHeavily indebted poor countries (HIPC)High incomeHondurasHong Kong SAR, ChinaHungaryIcelandIDA blendIDA onlyIDA totalIndiaIndonesiaIran, Islamic Rep.IraqIrelandIsraelItalyJamaicaJapanJordanKazakhstanKenyaKiribatiKorea, Rep.KuwaitKyrgyz RepublicLao PDRLatin America & Caribbean Latin America & Caribbean (excluding high income)Latin America & the Caribbean (IDA & IBRD countries)LatviaLeast developed countries: UN classificationLebanonLesothoLiberiaLithuaniaLow incomeLower middle incomeLuxembourgMacao SAR, ChinaMacedonia, FYRMadagascarMalawiMalaysiaMaldivesMaliMaltaMauritiusMexicoMicronesia, Fed. Sts.Middle East & North Africa (excluding high income)Middle East & North Africa (IDA & IBRD countries)MoldovaMongoliaMoroccoMozambiqueMyanmarNamibiaNepalNetherlandsNew ZealandNicaraguaNigeriaNorth AmericaNorwayOECD membersOmanOther small statesPacific island small statesPakistanPanamaPapua New GuineaParaguayPeruPhilippinesPolandPortugalPost-demographic dividendPre-demographic dividendQatarRomaniaRussian FederationRwandaSamoaSan MarinoSao Tome and PrincipeSenegalSerbiaSeychellesSierra LeoneSingaporeSlovak RepublicSloveniaSmall statesSolomon IslandsSouth AfricaSouth AsiaSouth Asia (IDA & IBRD)SpainSri LankaSt. Kitts and NevisSt. LuciaSub-Saharan Africa Sub-Saharan Africa (excluding high income)Sub-Saharan Africa (IDA & IBRD countries)SurinameSwazilandSwedenSwitzerlandSyrian Arab RepublicTajikistanTanzaniaThailandTimor-LesteTogoTrinidad and TobagoTunisiaTurkeyUgandaUkraineUnited Arab EmiratesUnited KingdomUnited StatesUruguayVanuatuVenezuela, RBVietnamWest Bank and GazaWorldYemen, Rep.ZambiaZimbabwe Timeline:
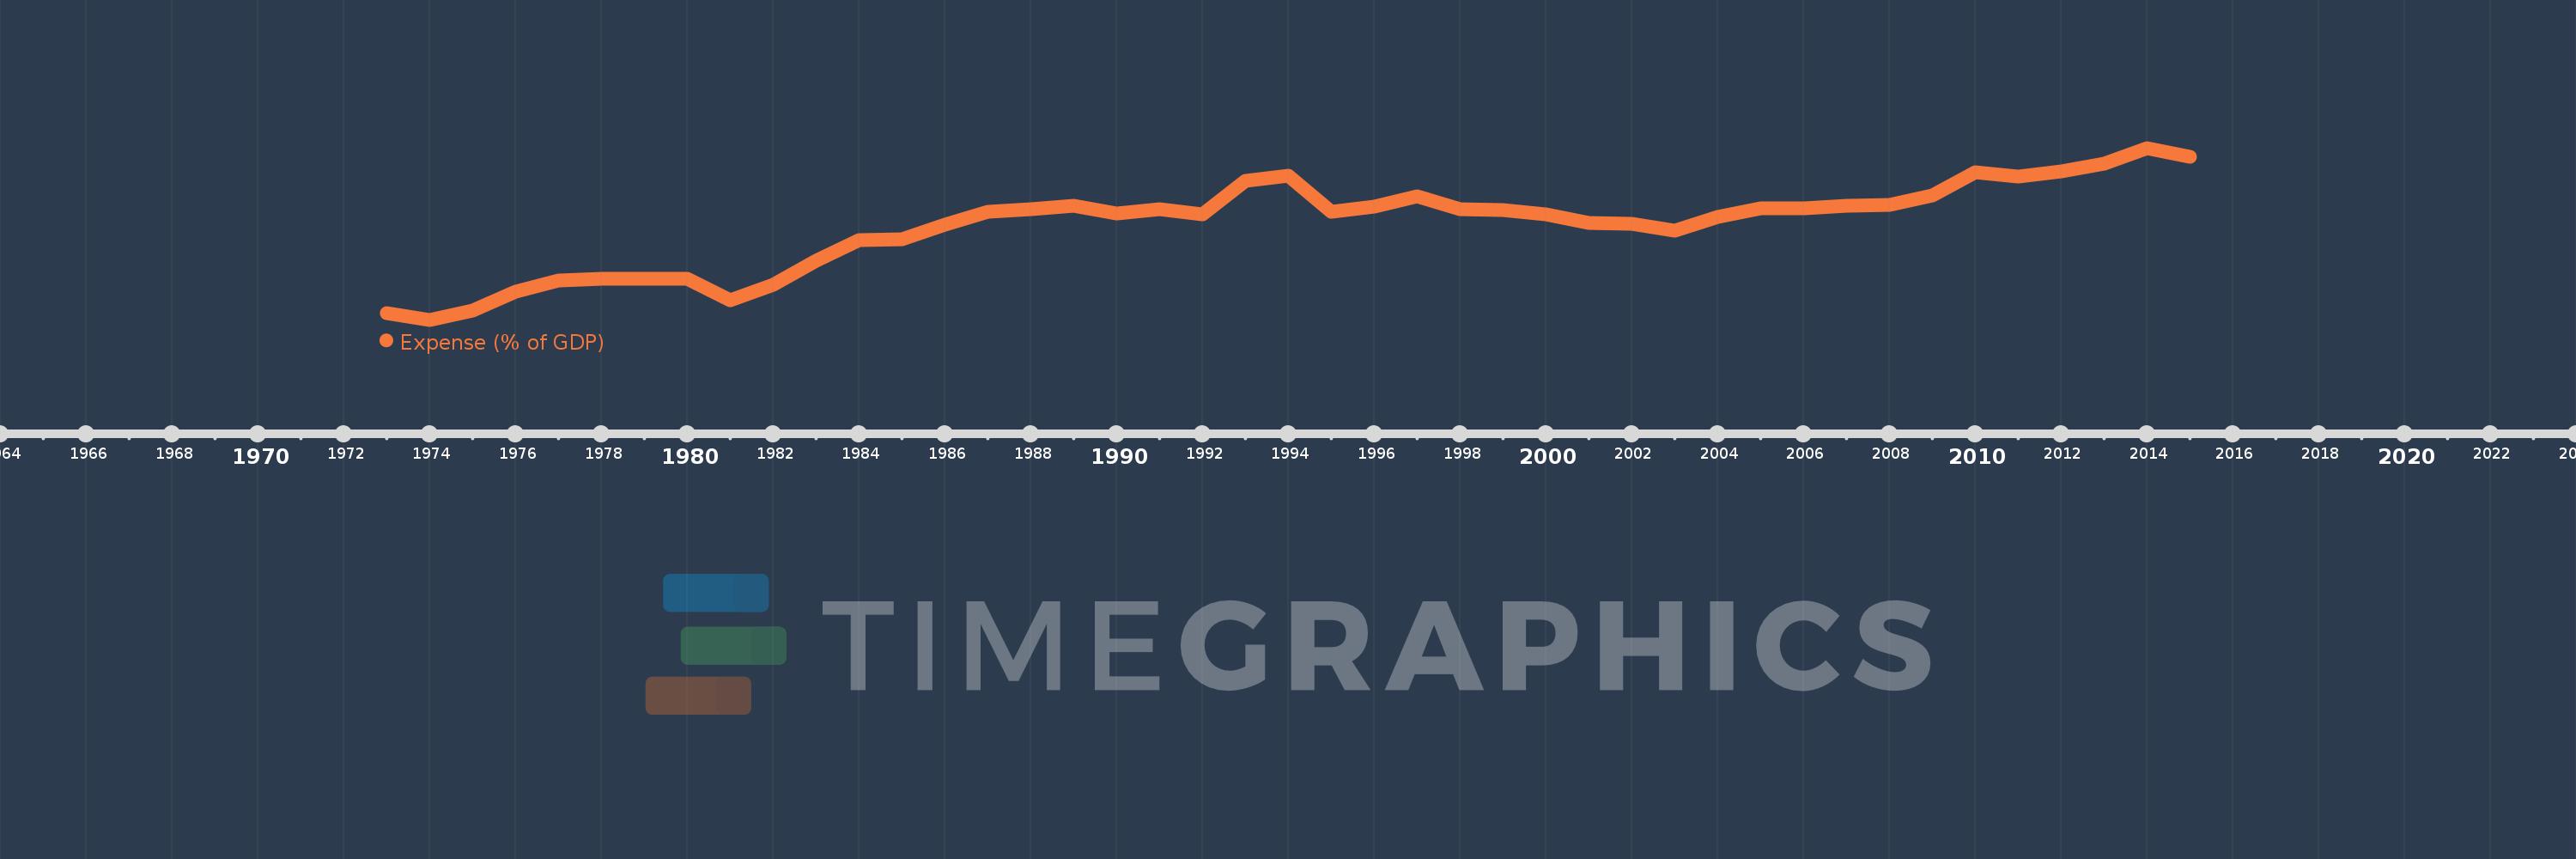
This timeline shows a graph from 1973 to 2015 of South Africa. No data until 1972. Number of actual observations by date: 43.
Source name:
World Development Indicators
Source organization:
International Monetary Fund, Government Finance Statistics Yearbook and data files, and World Bank and OECD GDP estimates.
Categories, topics:
Economy & Growth, Public Sector
Last updated:
apr 23, 2017
Indicators value changes by year
Minimum:
17.639
jan 1, 1974
Maximum:
34.658
jan 1, 2014
At the date of observation
Value
Absolute change
Change from previous value
jan 1, 1973
18.266
+18.266
0.0%
jan 1, 1974
17.639
-0.627
-3.43%
jan 1, 1975
18.585
+0.946
5.36%
jan 1, 1976
20.459
+1.873
10.08%
jan 1, 1977
21.492
+1.034
5.05%
jan 1, 1978
21.689
+0.197
0.92%
jan 1, 1979
21.666
-0.023
-0.11%
jan 1, 1980
21.713
+0.047
0.22%
jan 1, 1981
19.611
-2.102
-9.68%
jan 1, 1982
21.085
+1.474
7.52%
jan 1, 1983
23.464
+2.379
11.28%
jan 1, 1984
25.501
+2.037
8.68%
jan 1, 1985
25.605
+0.104
0.41%
jan 1, 1986
27.053
+1.448
5.65%
jan 1, 1987
28.32
+1.267
4.68%
jan 1, 1988
28.618
+0.298
1.05%
jan 1, 1989
28.972
+0.354
1.24%
jan 1, 1990
28.145
-0.827
-2.85%
jan 1, 1991
28.587
+0.442
1.57%
jan 1, 1992
28.042
-0.545
-1.91%
jan 1, 1993
31.44
+3.399
12.12%
jan 1, 1994
31.951
+0.51
1.62%
jan 1, 1995
28.352
-3.599
-11.26%
jan 1, 1996
28.823
+0.472
1.66%
jan 1, 1997
29.879
+1.056
3.66%
jan 1, 1998
28.583
-1.296
-4.34%
jan 1, 1999
28.511
-0.072
-0.25%
jan 1, 2000
28.06
-0.452
-1.58%
jan 1, 2001
27.194
-0.866
-3.09%
jan 1, 2002
27.129
-0.065
-0.24%
jan 1, 2003
26.47
-0.658
-2.43%
jan 1, 2004
27.846
+1.376
5.2%
jan 1, 2005
28.65
+0.804
2.89%
jan 1, 2006
28.69
+0.04
0.14%
jan 1, 2007
28.907
+0.217
0.76%
jan 1, 2008
29.013
+0.105
0.36%
jan 1, 2009
29.96
+0.947
3.27%
jan 1, 2010
32.244
+2.285
7.63%
jan 1, 2011
31.784
-0.461
-1.43%
jan 1, 2012
32.32
+0.536
1.69%
jan 1, 2013
33.081
+0.761
2.35%
jan 1, 2014
34.658
+1.577
4.77%
jan 1, 2015
33.757
-0.9
-2.6%
Ranking of countries by current statistics by years


Comments: