29
/
en
AIzaSyAYiBZKx7MnpbEhh9jyipgxe19OcubqV5w
April 1, 2024
43538
Latin America & the Caribbean (IDA & IBRD countries)
TLA
false
2
1
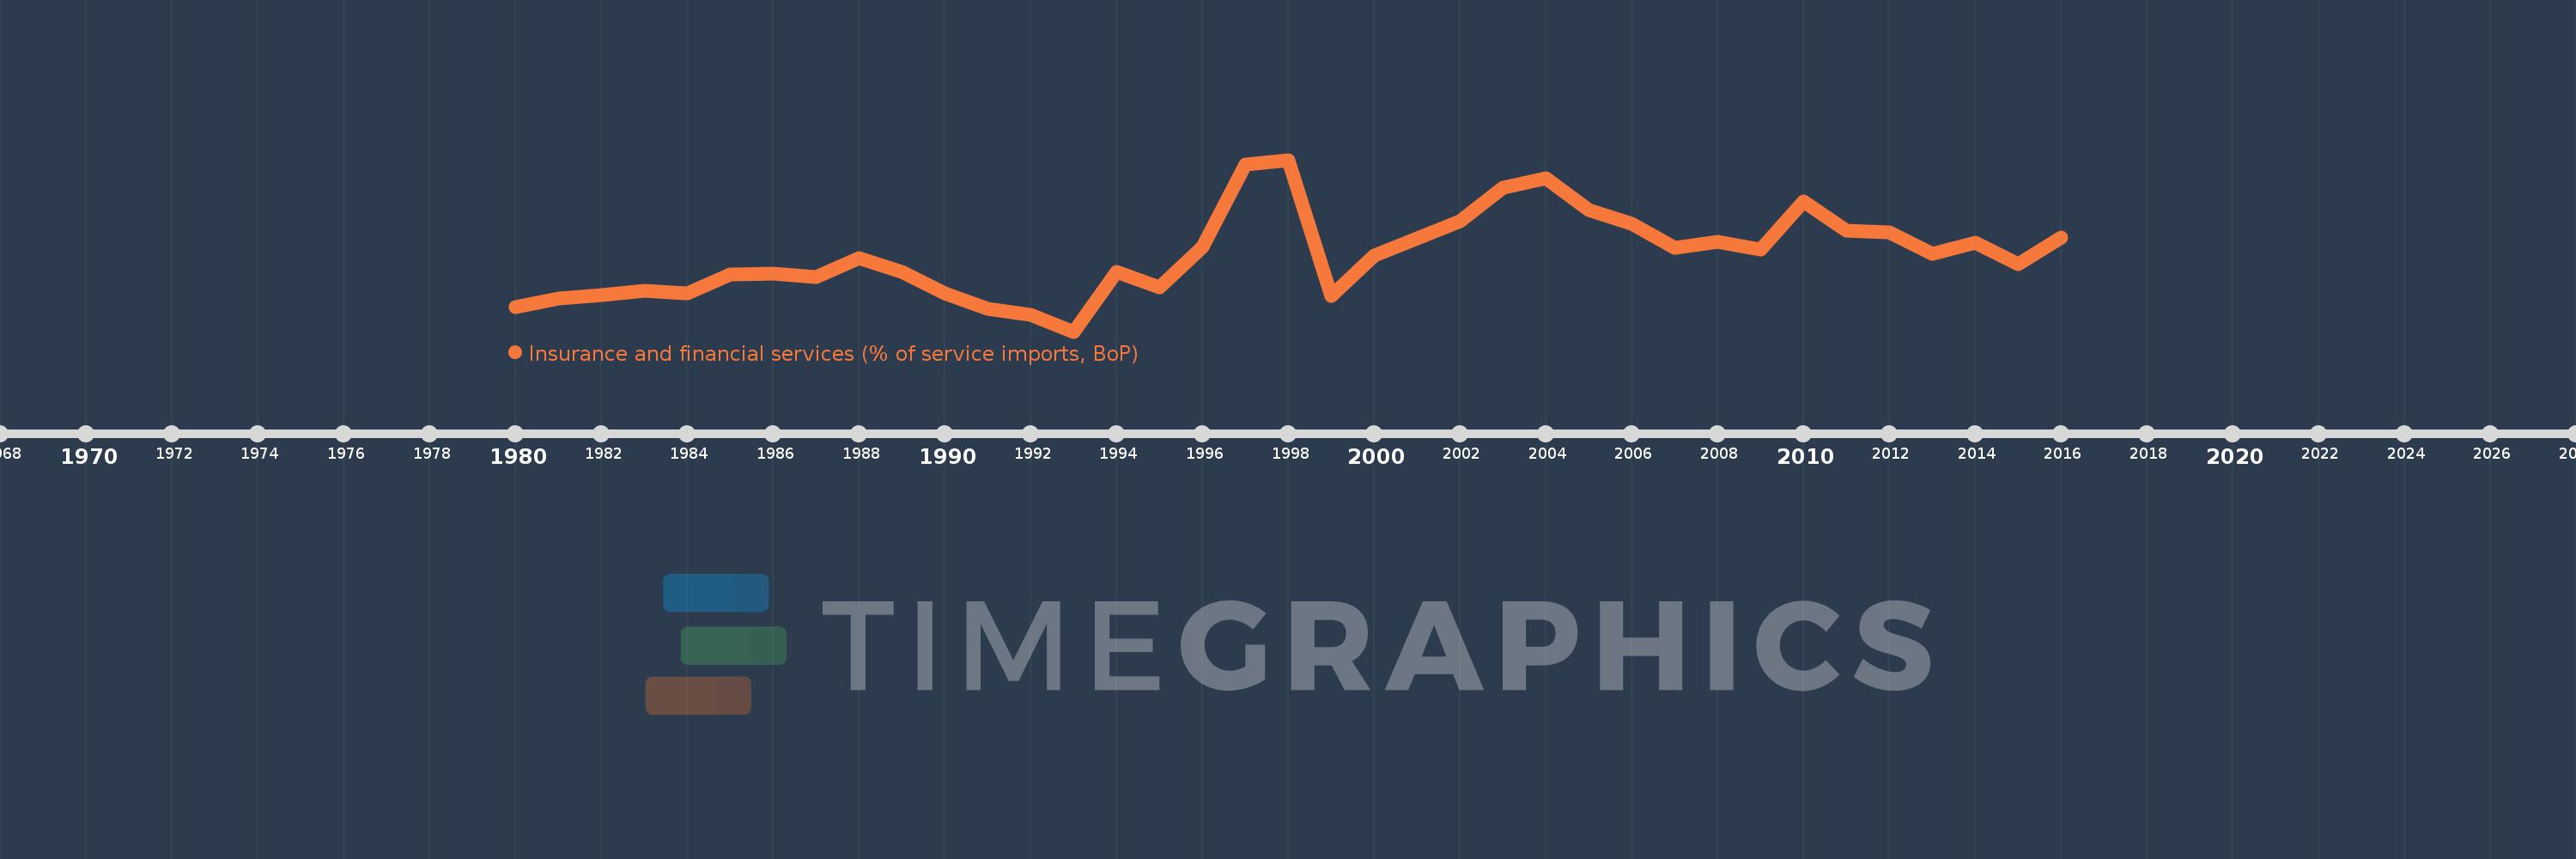
Insurance and financial services (% of service imports, BoP)
2016,2015,2014,2013,2012,2011,2010,2009,2008,2007,2006,2005,2004,2003,2002,2001,2000,1999,1998,1997,1996,1995,1994,1993,1992,1991,1990,1989,1988,1987,1986,1985,1984,1983,1982,1981,1980
This statistics in other country:
AfghanistanAlbaniaAlgeriaAngolaAntigua and BarbudaArab WorldArgentinaArmeniaArubaAustraliaAustriaAzerbaijanBahamas, TheBahrainBangladeshBarbadosBelarusBelgiumBelizeBeninBermudaBhutanBoliviaBosnia and HerzegovinaBotswanaBrazilBrunei DarussalamBulgariaBurkina FasoBurundiCabo VerdeCambodiaCameroonCanadaCaribbean small statesCentral African RepublicCentral Europe and the BalticsChadChileChinaColombiaComorosCongo, Dem. Rep.Congo, Rep.Costa RicaCote d'IvoireCroatiaCuracaoCyprusCzech RepublicDenmarkDjiboutiDominicaDominican RepublicEarly-demographic dividendEast Asia & PacificEast Asia & Pacific (excluding high income)East Asia & Pacific (IDA & IBRD countries)EcuadorEgypt, Arab Rep.El SalvadorEquatorial GuineaEritreaEstoniaEthiopiaEuro areaEurope & Central AsiaEurope & Central Asia (excluding high income)Europe & Central Asia (IDA & IBRD countries)European UnionFaroe IslandsFijiFinlandFragile and conflict affected situationsFranceFrench PolynesiaGabonGambia, TheGeorgiaGermanyGhanaGreeceGrenadaGuatemalaGuineaGuinea-BissauGuyanaHaitiHeavily indebted poor countries (HIPC)High incomeHondurasHong Kong SAR, ChinaHungaryIBRD onlyIcelandIDA & IBRD totalIDA onlyIDA totalIndiaIndonesiaIran, Islamic Rep.IraqIrelandIsraelItalyJamaicaJapanJordanKazakhstanKenyaKiribatiKorea, Rep.KosovoKuwaitKyrgyz RepublicLao PDRLate-demographic dividendLatin America & Caribbean Latin America & Caribbean (excluding high income)Latin America & the Caribbean (IDA & IBRD countries)LatviaLeast developed countries: UN classificationLebanonLesothoLiberiaLibyaLithuaniaLow & middle incomeLow incomeLower middle incomeLuxembourgMacao SAR, ChinaMacedonia, FYRMadagascarMalawiMalaysiaMaldivesMaliMaltaMarshall IslandsMauritaniaMauritiusMexicoMicronesia, Fed. Sts.Middle East & North AfricaMiddle East & North Africa (excluding high income)Middle East & North Africa (IDA & IBRD countries)Middle incomeMoldovaMongoliaMontenegroMoroccoMozambiqueMyanmarNamibiaNepalNetherlandsNew CaledoniaNew ZealandNicaraguaNigerNigeriaNorth AmericaNorwayOECD membersOmanOther small statesPacific island small statesPakistanPalauPanamaPapua New GuineaParaguayPeruPhilippinesPolandPortugalPost-demographic dividendPre-demographic dividendQatarRomaniaRussian FederationRwandaSamoaSao Tome and PrincipeSaudi ArabiaSenegalSerbiaSeychellesSierra LeoneSingaporeSint Maarten (Dutch part)Slovak RepublicSloveniaSmall statesSolomon IslandsSouth AfricaSouth AsiaSouth Asia (IDA & IBRD)South SudanSpainSri LankaSt. Kitts and NevisSt. LuciaSt. Vincent and the GrenadinesSub-Saharan Africa Sub-Saharan Africa (excluding high income)Sub-Saharan Africa (IDA & IBRD countries)SudanSurinameSwazilandSwedenSwitzerlandSyrian Arab RepublicTajikistanTanzaniaThailandTimor-LesteTogoTongaTrinidad and TobagoTunisiaTurkeyTuvaluUgandaUkraineUnited KingdomUnited StatesUpper middle incomeUruguayVanuatuVenezuela, RBWest Bank and GazaWorldYemen, Rep.ZambiaZimbabwe Timeline:
This timeline shows a graph from 1980 to 2016 of Latin America & the Caribbean (IDA & IBRD countries). No data until 1979. Number of actual observations by date: 37.
Source name:
World Development Indicators
Source organization:
International Monetary Fund, Balance of Payments Statistics Yearbook and data files.
Categories, topics:
Economy & Growth, Private Sector, Trade
Last updated:
apr 23, 2017
Indicators value changes by year
Maximum:
11.701
jan 1, 1998
At the date of observation
Value
Absolute change
Change from previous value
jan 1, 1980
5.715
+5.715
0.0%
jan 1, 1981
6.069
+0.354
6.19%
jan 1, 1982
6.199
+0.13
2.14%
jan 1, 1983
6.368
+0.169
2.73%
jan 1, 1984
6.257
-0.111
-1.75%
jan 1, 1985
7.024
+0.767
12.26%
jan 1, 1986
7.07
+0.046
0.66%
jan 1, 1987
6.941
-0.129
-1.83%
jan 1, 1988
7.699
+0.759
10.93%
jan 1, 1989
7.146
-0.553
-7.18%
jan 1, 1990
6.252
-0.895
-12.52%
jan 1, 1991
5.623
-0.629
-10.07%
jan 1, 1992
5.378
-0.245
-4.35%
jan 1, 1993
4.712
-0.665
-12.37%
jan 1, 1994
7.147
+2.435
51.67%
jan 1, 1995
6.501
-0.646
-9.04%
jan 1, 1996
8.162
+1.661
25.55%
jan 1, 1997
11.517
+3.355
41.11%
jan 1, 1998
11.701
+0.184
1.6%
jan 1, 1999
6.159
-5.542
-47.36%
jan 1, 2000
7.795
+1.636
26.57%
jan 1, 2001
8.498
+0.703
9.02%
jan 1, 2002
9.215
+0.717
8.44%
jan 1, 2003
10.572
+1.357
14.73%
jan 1, 2004
10.966
+0.393
3.72%
jan 1, 2005
9.646
-1.32
-12.04%
jan 1, 2006
9.101
-0.545
-5.65%
jan 1, 2007
8.106
-0.995
-10.93%
jan 1, 2008
8.352
+0.246
3.04%
jan 1, 2009
8.06
-0.292
-3.49%
jan 1, 2010
10.002
+1.942
24.09%
jan 1, 2011
8.821
-1.181
-11.81%
jan 1, 2012
8.736
-0.086
-0.97%
jan 1, 2013
7.886
-0.85
-9.73%
jan 1, 2014
8.316
+0.43
5.45%
jan 1, 2015
7.465
-0.851
-10.24%
jan 1, 2016
8.528
+1.063
14.24%
Ranking of countries by current statistics by years


Comments: