29
/
en
AIzaSyAYiBZKx7MnpbEhh9jyipgxe19OcubqV5w
April 1, 2024
59903
Sub-Saharan Africa (excluding high income)
SSA
false
2
1
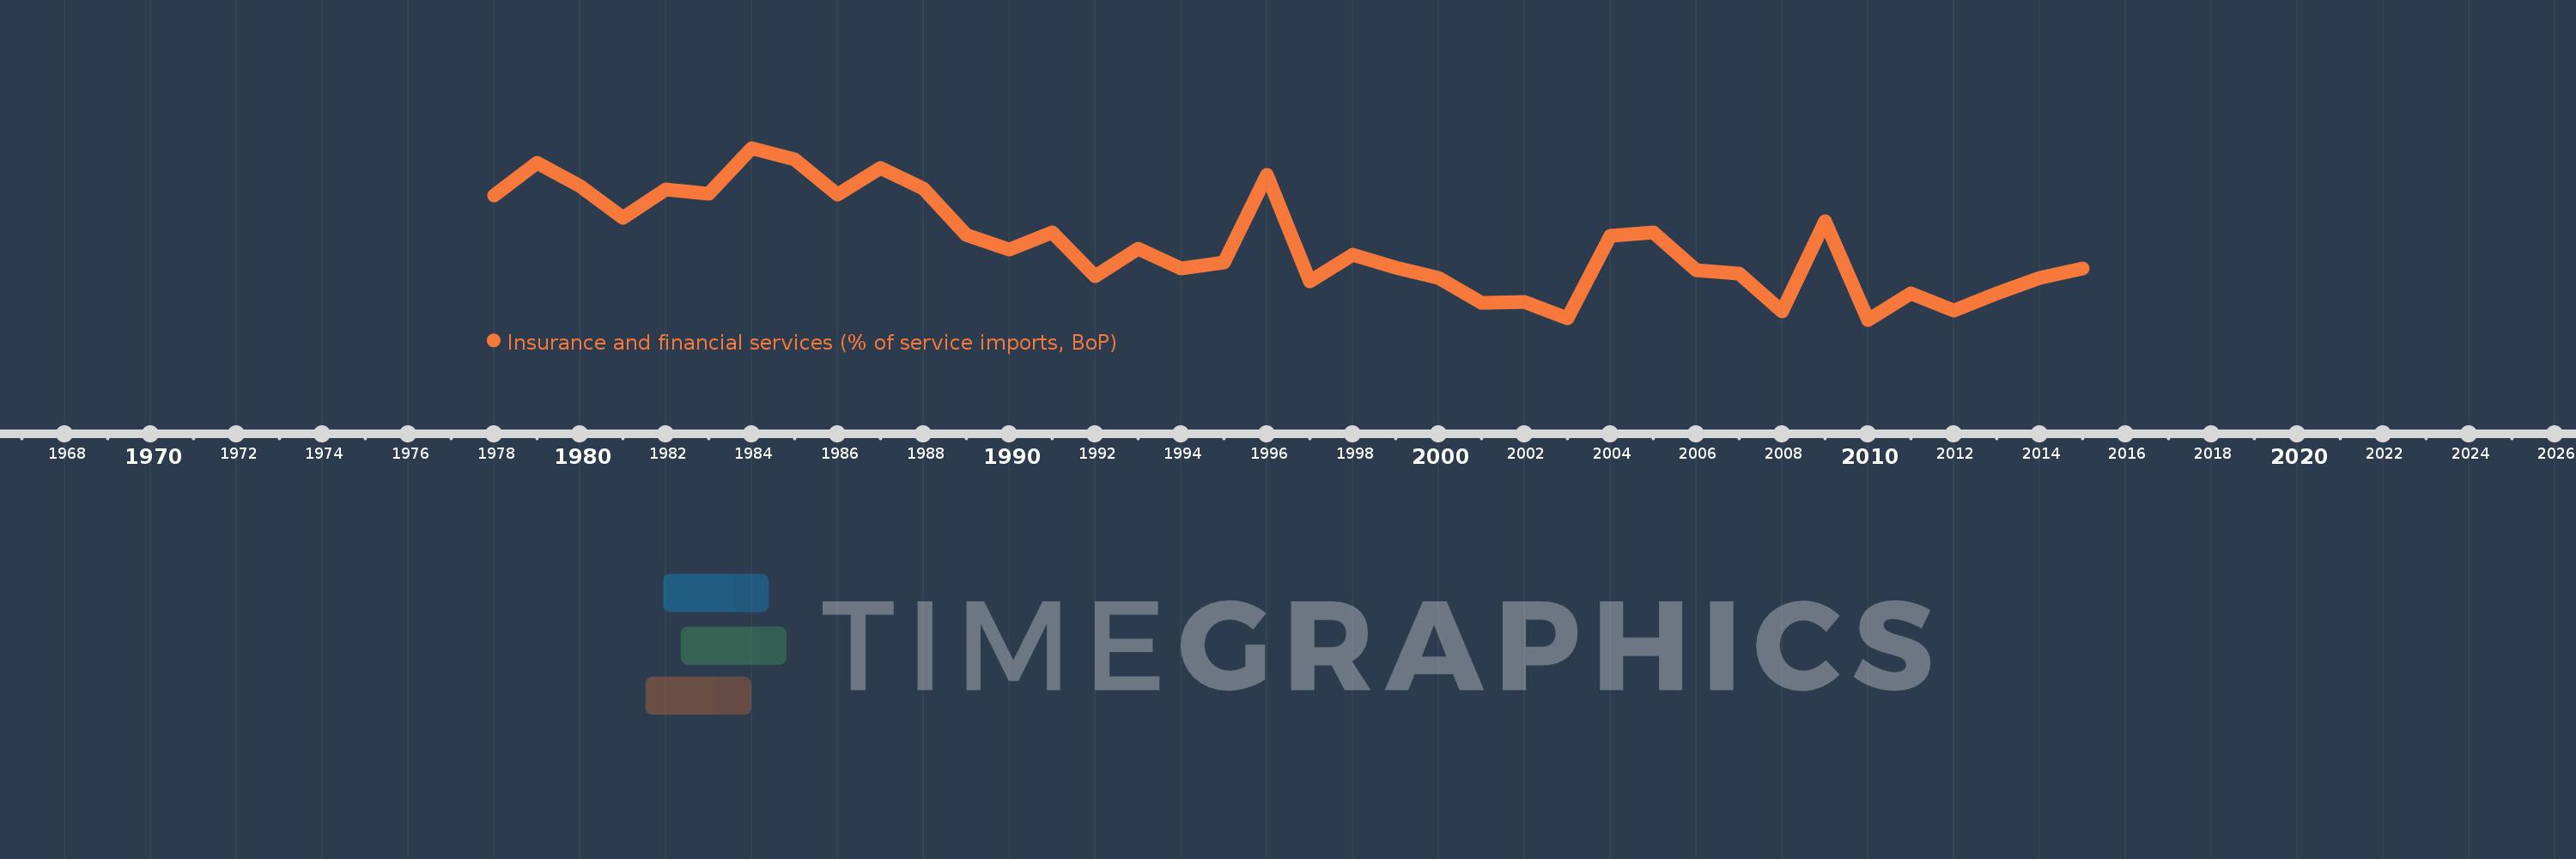
Insurance and financial services (% of service imports, BoP)
2015,2014,2013,2012,2011,2010,2009,2008,2007,2006,2005,2004,2003,2002,2001,2000,1999,1998,1997,1996,1995,1994,1993,1992,1991,1990,1989,1988,1987,1986,1985,1984,1983,1982,1981,1980,1979,1978
This statistics in other country:
AfghanistanAlbaniaAlgeriaAngolaAntigua and BarbudaArab WorldArgentinaArmeniaArubaAustraliaAustriaAzerbaijanBahamas, TheBahrainBangladeshBarbadosBelarusBelgiumBelizeBeninBermudaBhutanBoliviaBosnia and HerzegovinaBotswanaBrazilBrunei DarussalamBulgariaBurkina FasoBurundiCabo VerdeCambodiaCameroonCanadaCaribbean small statesCentral African RepublicCentral Europe and the BalticsChadChileChinaColombiaComorosCongo, Dem. Rep.Congo, Rep.Costa RicaCote d'IvoireCroatiaCuracaoCyprusCzech RepublicDenmarkDjiboutiDominicaDominican RepublicEarly-demographic dividendEast Asia & PacificEast Asia & Pacific (excluding high income)East Asia & Pacific (IDA & IBRD countries)EcuadorEgypt, Arab Rep.El SalvadorEquatorial GuineaEritreaEstoniaEthiopiaEuro areaEurope & Central AsiaEurope & Central Asia (excluding high income)Europe & Central Asia (IDA & IBRD countries)European UnionFaroe IslandsFijiFinlandFragile and conflict affected situationsFranceFrench PolynesiaGabonGambia, TheGeorgiaGermanyGhanaGreeceGrenadaGuatemalaGuineaGuinea-BissauGuyanaHaitiHeavily indebted poor countries (HIPC)High incomeHondurasHong Kong SAR, ChinaHungaryIBRD onlyIcelandIDA & IBRD totalIDA onlyIDA totalIndiaIndonesiaIran, Islamic Rep.IraqIrelandIsraelItalyJamaicaJapanJordanKazakhstanKenyaKiribatiKorea, Rep.KosovoKuwaitKyrgyz RepublicLao PDRLate-demographic dividendLatin America & Caribbean Latin America & Caribbean (excluding high income)Latin America & the Caribbean (IDA & IBRD countries)LatviaLeast developed countries: UN classificationLebanonLesothoLiberiaLibyaLithuaniaLow & middle incomeLow incomeLower middle incomeLuxembourgMacao SAR, ChinaMacedonia, FYRMadagascarMalawiMalaysiaMaldivesMaliMaltaMarshall IslandsMauritaniaMauritiusMexicoMicronesia, Fed. Sts.Middle East & North AfricaMiddle East & North Africa (excluding high income)Middle East & North Africa (IDA & IBRD countries)Middle incomeMoldovaMongoliaMontenegroMoroccoMozambiqueMyanmarNamibiaNepalNetherlandsNew CaledoniaNew ZealandNicaraguaNigerNigeriaNorth AmericaNorwayOECD membersOmanOther small statesPacific island small statesPakistanPalauPanamaPapua New GuineaParaguayPeruPhilippinesPolandPortugalPost-demographic dividendPre-demographic dividendQatarRomaniaRussian FederationRwandaSamoaSao Tome and PrincipeSaudi ArabiaSenegalSerbiaSeychellesSierra LeoneSingaporeSint Maarten (Dutch part)Slovak RepublicSloveniaSmall statesSolomon IslandsSouth AfricaSouth AsiaSouth Asia (IDA & IBRD)South SudanSpainSri LankaSt. Kitts and NevisSt. LuciaSt. Vincent and the GrenadinesSub-Saharan Africa Sub-Saharan Africa (excluding high income)Sub-Saharan Africa (IDA & IBRD countries)SudanSurinameSwazilandSwedenSwitzerlandSyrian Arab RepublicTajikistanTanzaniaThailandTimor-LesteTogoTongaTrinidad and TobagoTunisiaTurkeyTuvaluUgandaUkraineUnited KingdomUnited StatesUpper middle incomeUruguayVanuatuVenezuela, RBWest Bank and GazaWorldYemen, Rep.ZambiaZimbabwe Timeline:
This timeline shows a graph from 1978 to 2015 of Sub-Saharan Africa (excluding high income). No data until 1977. Number of actual observations by date: 38.
Source name:
World Development Indicators
Source organization:
International Monetary Fund, Balance of Payments Statistics Yearbook and data files.
Categories, topics:
Economy & Growth, Private Sector, Trade
Last updated:
apr 23, 2017
Indicators value changes by year
At the date of observation
Value
Absolute change
Change from previous value
jan 1, 1978
6.35
+6.35
0.0%
jan 1, 1979
6.875
+0.526
8.28%
jan 1, 1980
6.498
-0.377
-5.49%
jan 1, 1981
5.983
-0.515
-7.92%
jan 1, 1982
6.436
+0.453
7.56%
jan 1, 1983
6.366
-0.07
-1.09%
jan 1, 1984
7.123
+0.757
11.9%
jan 1, 1985
6.939
-0.184
-2.58%
jan 1, 1986
6.356
-0.583
-8.4%
jan 1, 1987
6.795
+0.438
6.9%
jan 1, 1988
6.461
-0.334
-4.91%
jan 1, 1989
5.697
-0.764
-11.83%
jan 1, 1990
5.457
-0.24
-4.21%
jan 1, 1991
5.741
+0.284
5.2%
jan 1, 1992
5.017
-0.724
-12.61%
jan 1, 1993
5.473
+0.456
9.1%
jan 1, 1994
5.15
-0.324
-5.91%
jan 1, 1995
5.242
+0.093
1.8%
jan 1, 1996
6.682
+1.44
27.46%
jan 1, 1997
4.937
-1.745
-26.12%
jan 1, 1998
5.368
+0.431
8.73%
jan 1, 1999
5.166
-0.202
-3.76%
jan 1, 2000
4.995
-0.171
-3.3%
jan 1, 2001
4.584
-0.411
-8.23%
jan 1, 2002
4.597
+0.012
0.27%
jan 1, 2003
4.328
-0.268
-5.84%
jan 1, 2004
5.682
+1.354
31.29%
jan 1, 2005
5.733
+0.051
0.9%
jan 1, 2006
5.124
-0.609
-10.62%
jan 1, 2007
5.055
-0.07
-1.36%
jan 1, 2008
4.445
-0.609
-12.05%
jan 1, 2009
5.926
+1.481
33.31%
jan 1, 2010
4.305
-1.621
-27.35%
jan 1, 2011
4.733
+0.428
9.95%
jan 1, 2012
4.459
-0.275
-5.8%
jan 1, 2013
4.739
+0.281
6.3%
jan 1, 2014
4.995
+0.255
5.38%
jan 1, 2015
5.148
+0.154
3.08%
Ranking of countries by current statistics by years


Comments: