29
/
en
AIzaSyAYiBZKx7MnpbEhh9jyipgxe19OcubqV5w
April 1, 2024
152679
Hungary
HUN
true
2
1
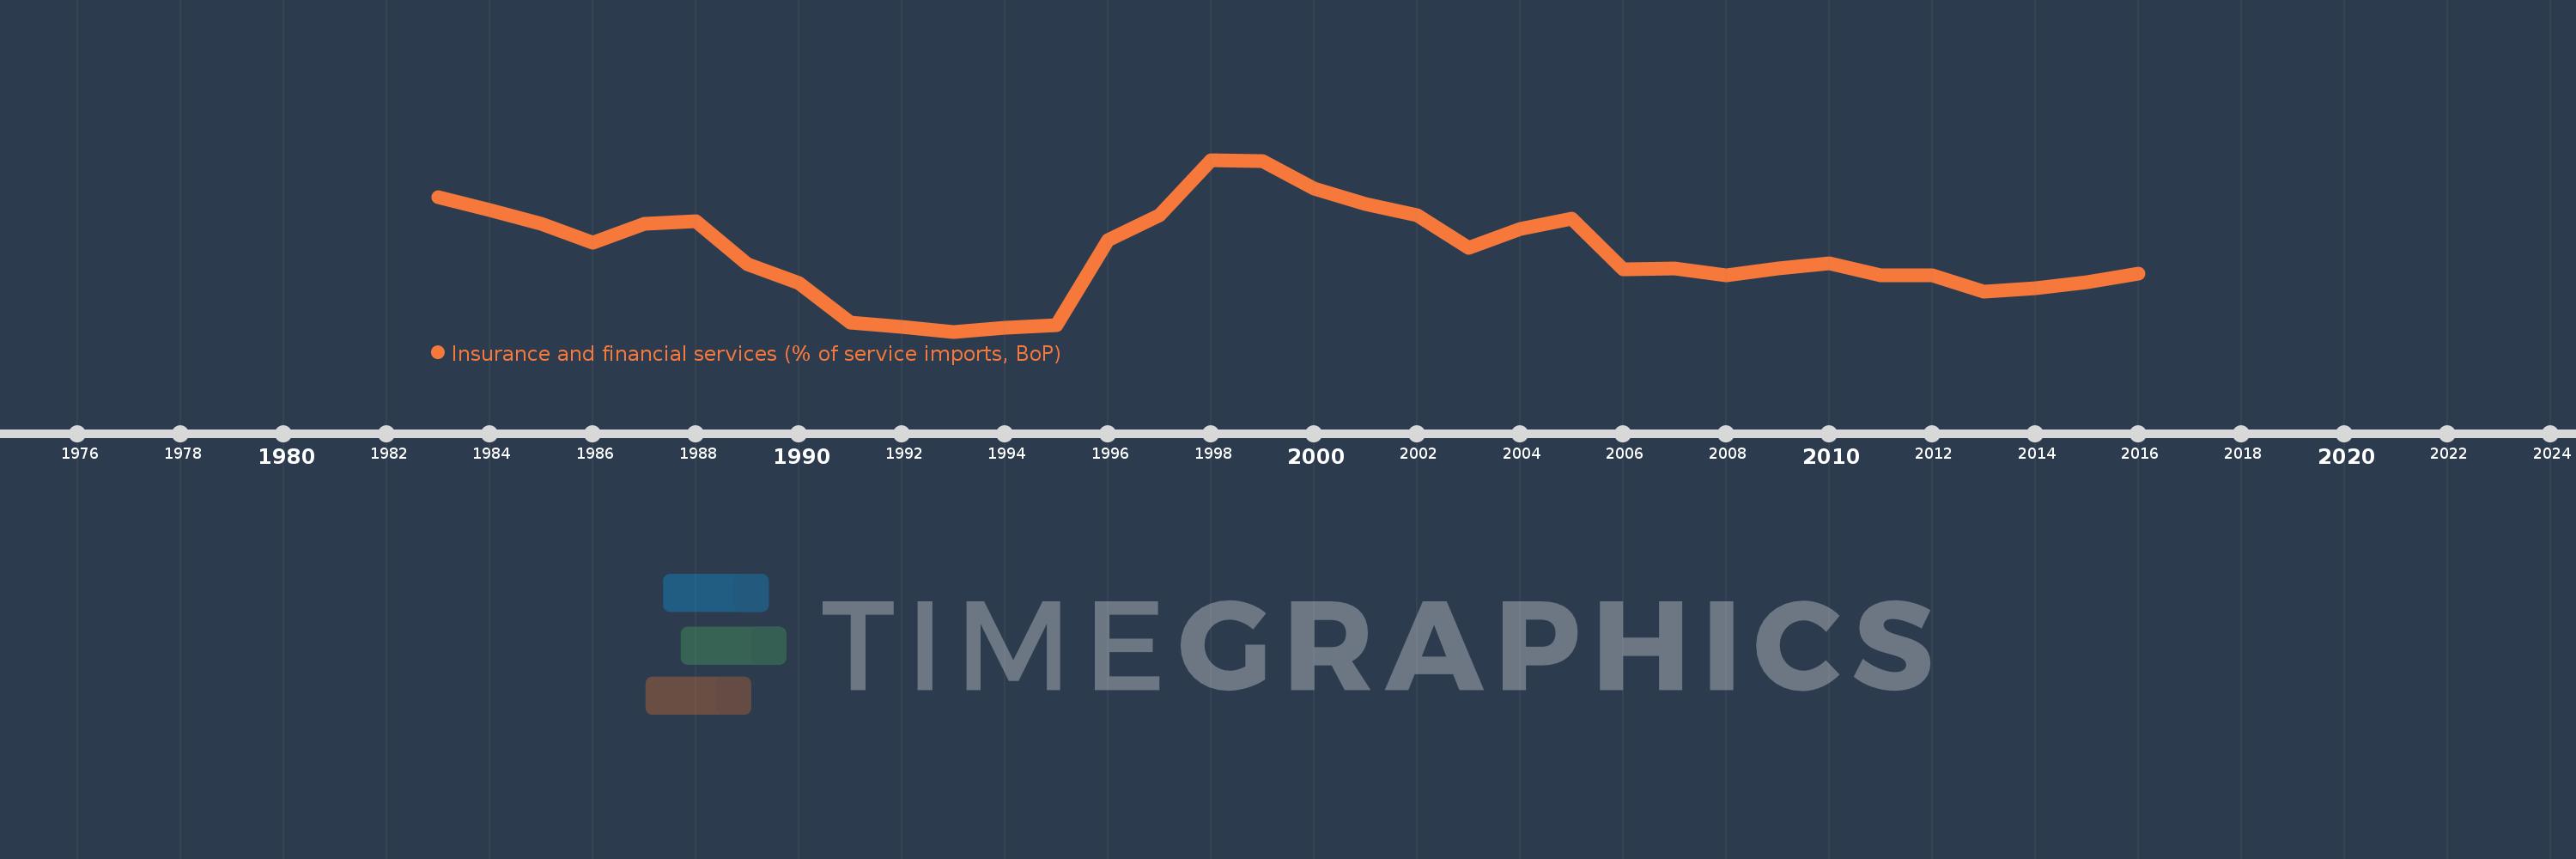
Insurance and financial services (% of service imports, BoP)
2016,2015,2014,2013,2012,2011,2010,2009,2008,2007,2006,2005,2004,2003,2002,2001,2000,1999,1998,1997,1996,1995,1994,1993,1992,1991,1990,1989,1988,1987,1986,1985,1984,1983
This statistics in other country:
AfghanistanAlbaniaAlgeriaAngolaAntigua and BarbudaArab WorldArgentinaArmeniaArubaAustraliaAustriaAzerbaijanBahamas, TheBahrainBangladeshBarbadosBelarusBelgiumBelizeBeninBermudaBhutanBoliviaBosnia and HerzegovinaBotswanaBrazilBrunei DarussalamBulgariaBurkina FasoBurundiCabo VerdeCambodiaCameroonCanadaCaribbean small statesCentral African RepublicCentral Europe and the BalticsChadChileChinaColombiaComorosCongo, Dem. Rep.Congo, Rep.Costa RicaCote d'IvoireCroatiaCuracaoCyprusCzech RepublicDenmarkDjiboutiDominicaDominican RepublicEarly-demographic dividendEast Asia & PacificEast Asia & Pacific (excluding high income)East Asia & Pacific (IDA & IBRD countries)EcuadorEgypt, Arab Rep.El SalvadorEquatorial GuineaEritreaEstoniaEthiopiaEuro areaEurope & Central AsiaEurope & Central Asia (excluding high income)Europe & Central Asia (IDA & IBRD countries)European UnionFaroe IslandsFijiFinlandFragile and conflict affected situationsFranceFrench PolynesiaGabonGambia, TheGeorgiaGermanyGhanaGreeceGrenadaGuatemalaGuineaGuinea-BissauGuyanaHaitiHeavily indebted poor countries (HIPC)High incomeHondurasHong Kong SAR, ChinaHungaryIBRD onlyIcelandIDA & IBRD totalIDA onlyIDA totalIndiaIndonesiaIran, Islamic Rep.IraqIrelandIsraelItalyJamaicaJapanJordanKazakhstanKenyaKiribatiKorea, Rep.KosovoKuwaitKyrgyz RepublicLao PDRLate-demographic dividendLatin America & Caribbean Latin America & Caribbean (excluding high income)Latin America & the Caribbean (IDA & IBRD countries)LatviaLeast developed countries: UN classificationLebanonLesothoLiberiaLibyaLithuaniaLow & middle incomeLow incomeLower middle incomeLuxembourgMacao SAR, ChinaMacedonia, FYRMadagascarMalawiMalaysiaMaldivesMaliMaltaMarshall IslandsMauritaniaMauritiusMexicoMicronesia, Fed. Sts.Middle East & North AfricaMiddle East & North Africa (excluding high income)Middle East & North Africa (IDA & IBRD countries)Middle incomeMoldovaMongoliaMontenegroMoroccoMozambiqueMyanmarNamibiaNepalNetherlandsNew CaledoniaNew ZealandNicaraguaNigerNigeriaNorth AmericaNorwayOECD membersOmanOther small statesPacific island small statesPakistanPalauPanamaPapua New GuineaParaguayPeruPhilippinesPolandPortugalPost-demographic dividendPre-demographic dividendQatarRomaniaRussian FederationRwandaSamoaSao Tome and PrincipeSaudi ArabiaSenegalSerbiaSeychellesSierra LeoneSingaporeSint Maarten (Dutch part)Slovak RepublicSloveniaSmall statesSolomon IslandsSouth AfricaSouth AsiaSouth Asia (IDA & IBRD)South SudanSpainSri LankaSt. Kitts and NevisSt. LuciaSt. Vincent and the GrenadinesSub-Saharan Africa Sub-Saharan Africa (excluding high income)Sub-Saharan Africa (IDA & IBRD countries)SudanSurinameSwazilandSwedenSwitzerlandSyrian Arab RepublicTajikistanTanzaniaThailandTimor-LesteTogoTongaTrinidad and TobagoTunisiaTurkeyTuvaluUgandaUkraineUnited KingdomUnited StatesUpper middle incomeUruguayVanuatuVenezuela, RBWest Bank and GazaWorldYemen, Rep.ZambiaZimbabwe Timeline:
This timeline shows a graph from 1983 to 2016 of Hungary. No data until 1982. Number of actual observations by date: 34.
Source name:
World Development Indicators
Source organization:
International Monetary Fund, Balance of Payments Statistics Yearbook and data files.
Categories, topics:
Economy & Growth, Private Sector, Trade
Last updated:
apr 23, 2017
Indicators value changes by year
At the date of observation
Value
Absolute change
Change from previous value
jan 1, 1983
6.698
+6.698
0.0%
jan 1, 1984
6.103
-0.595
-8.88%
jan 1, 1985
5.471
-0.632
-10.36%
jan 1, 1986
4.578
-0.893
-16.32%
jan 1, 1987
5.47
+0.892
19.48%
jan 1, 1988
5.602
+0.132
2.42%
jan 1, 1989
3.594
-2.008
-35.84%
jan 1, 1990
2.756
-0.838
-23.31%
jan 1, 1991
0.924
-1.832
-66.47%
jan 1, 1992
0.717
-0.207
-22.43%
jan 1, 1993
0.51
-0.207
-28.88%
jan 1, 1994
0.684
+0.174
34.2%
jan 1, 1995
0.788
+0.103
15.12%
jan 1, 1996
4.706
+3.918
497.45%
jan 1, 1997
5.877
+1.171
24.89%
jan 1, 1998
8.405
+2.528
43.02%
jan 1, 1999
8.352
-0.053
-0.63%
jan 1, 2000
7.065
-1.287
-15.41%
jan 1, 2001
6.389
-0.676
-9.56%
jan 1, 2002
5.864
-0.526
-8.22%
jan 1, 2003
4.35
-1.514
-25.81%
jan 1, 2004
5.24
+0.89
20.45%
jan 1, 2005
5.685
+0.445
8.49%
jan 1, 2006
3.362
-2.323
-40.87%
jan 1, 2007
3.405
+0.043
1.29%
jan 1, 2008
3.112
-0.293
-8.61%
jan 1, 2009
3.41
+0.298
9.59%
jan 1, 2010
3.662
+0.252
7.39%
jan 1, 2011
3.098
-0.564
-15.4%
jan 1, 2012
3.085
-0.013
-0.42%
jan 1, 2013
2.348
-0.737
-23.9%
jan 1, 2014
2.514
+0.166
7.05%
jan 1, 2015
2.763
+0.249
9.9%
jan 1, 2016
3.176
+0.414
14.98%
Ranking of countries by current statistics by years


Comments: