29
/
en
AIzaSyAYiBZKx7MnpbEhh9jyipgxe19OcubqV5w
April 1, 2024
40809
Late-demographic dividend
LTE
false
2
1
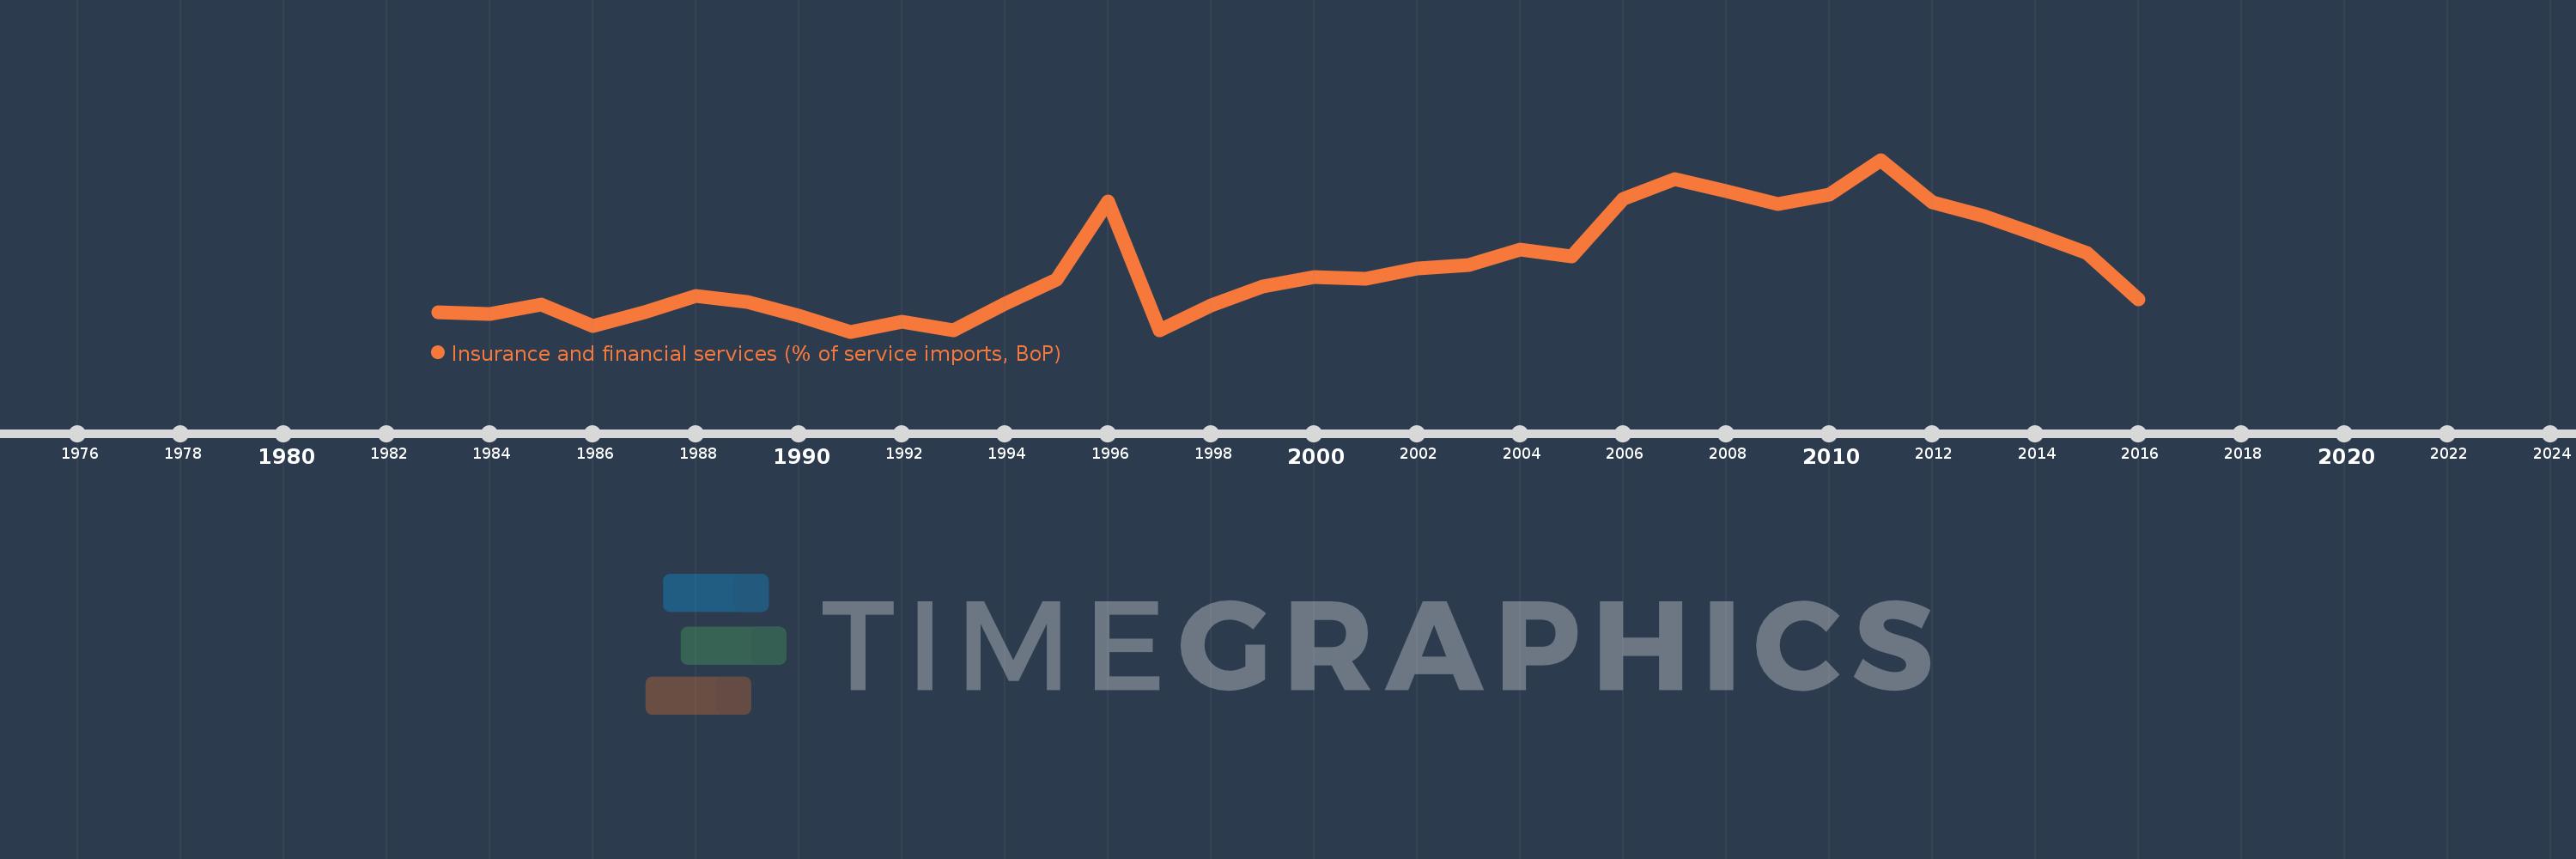
Insurance and financial services (% of service imports, BoP)
2016,2015,2014,2013,2012,2011,2010,2009,2008,2007,2006,2005,2004,2003,2002,2001,2000,1999,1998,1997,1996,1995,1994,1993,1992,1991,1990,1989,1988,1987,1986,1985,1984,1983
This statistics in other country:
AfghanistanAlbaniaAlgeriaAngolaAntigua and BarbudaArab WorldArgentinaArmeniaArubaAustraliaAustriaAzerbaijanBahamas, TheBahrainBangladeshBarbadosBelarusBelgiumBelizeBeninBermudaBhutanBoliviaBosnia and HerzegovinaBotswanaBrazilBrunei DarussalamBulgariaBurkina FasoBurundiCabo VerdeCambodiaCameroonCanadaCaribbean small statesCentral African RepublicCentral Europe and the BalticsChadChileChinaColombiaComorosCongo, Dem. Rep.Congo, Rep.Costa RicaCote d'IvoireCroatiaCuracaoCyprusCzech RepublicDenmarkDjiboutiDominicaDominican RepublicEarly-demographic dividendEast Asia & PacificEast Asia & Pacific (excluding high income)East Asia & Pacific (IDA & IBRD countries)EcuadorEgypt, Arab Rep.El SalvadorEquatorial GuineaEritreaEstoniaEthiopiaEuro areaEurope & Central AsiaEurope & Central Asia (excluding high income)Europe & Central Asia (IDA & IBRD countries)European UnionFaroe IslandsFijiFinlandFragile and conflict affected situationsFranceFrench PolynesiaGabonGambia, TheGeorgiaGermanyGhanaGreeceGrenadaGuatemalaGuineaGuinea-BissauGuyanaHaitiHeavily indebted poor countries (HIPC)High incomeHondurasHong Kong SAR, ChinaHungaryIBRD onlyIcelandIDA & IBRD totalIDA onlyIDA totalIndiaIndonesiaIran, Islamic Rep.IraqIrelandIsraelItalyJamaicaJapanJordanKazakhstanKenyaKiribatiKorea, Rep.KosovoKuwaitKyrgyz RepublicLao PDRLate-demographic dividendLatin America & Caribbean Latin America & Caribbean (excluding high income)Latin America & the Caribbean (IDA & IBRD countries)LatviaLeast developed countries: UN classificationLebanonLesothoLiberiaLibyaLithuaniaLow & middle incomeLow incomeLower middle incomeLuxembourgMacao SAR, ChinaMacedonia, FYRMadagascarMalawiMalaysiaMaldivesMaliMaltaMarshall IslandsMauritaniaMauritiusMexicoMicronesia, Fed. Sts.Middle East & North AfricaMiddle East & North Africa (excluding high income)Middle East & North Africa (IDA & IBRD countries)Middle incomeMoldovaMongoliaMontenegroMoroccoMozambiqueMyanmarNamibiaNepalNetherlandsNew CaledoniaNew ZealandNicaraguaNigerNigeriaNorth AmericaNorwayOECD membersOmanOther small statesPacific island small statesPakistanPalauPanamaPapua New GuineaParaguayPeruPhilippinesPolandPortugalPost-demographic dividendPre-demographic dividendQatarRomaniaRussian FederationRwandaSamoaSao Tome and PrincipeSaudi ArabiaSenegalSerbiaSeychellesSierra LeoneSingaporeSint Maarten (Dutch part)Slovak RepublicSloveniaSmall statesSolomon IslandsSouth AfricaSouth AsiaSouth Asia (IDA & IBRD)South SudanSpainSri LankaSt. Kitts and NevisSt. LuciaSt. Vincent and the GrenadinesSub-Saharan Africa Sub-Saharan Africa (excluding high income)Sub-Saharan Africa (IDA & IBRD countries)SudanSurinameSwazilandSwedenSwitzerlandSyrian Arab RepublicTajikistanTanzaniaThailandTimor-LesteTogoTongaTrinidad and TobagoTunisiaTurkeyTuvaluUgandaUkraineUnited KingdomUnited StatesUpper middle incomeUruguayVanuatuVenezuela, RBWest Bank and GazaWorldYemen, Rep.ZambiaZimbabwe Timeline:
This timeline shows a graph from 1983 to 2016 of Late-demographic dividend. No data until 1982. Number of actual observations by date: 34.
Source name:
World Development Indicators
Source organization:
International Monetary Fund, Balance of Payments Statistics Yearbook and data files.
Categories, topics:
Economy & Growth, Private Sector, Trade
Last updated:
apr 23, 2017
Indicators value changes by year
At the date of observation
Value
Absolute change
Change from previous value
jan 1, 1983
4.524
+4.524
0.0%
jan 1, 1984
4.464
-0.06
-1.32%
jan 1, 1985
4.754
+0.29
6.49%
jan 1, 1986
4.116
-0.638
-13.41%
jan 1, 1987
4.512
+0.396
9.63%
jan 1, 1988
5.028
+0.516
11.44%
jan 1, 1989
4.823
-0.206
-4.09%
jan 1, 1990
4.426
-0.397
-8.23%
jan 1, 1991
3.94
-0.485
-10.97%
jan 1, 1992
4.244
+0.304
7.72%
jan 1, 1993
3.984
-0.261
-6.14%
jan 1, 1994
4.785
+0.801
20.1%
jan 1, 1995
5.52
+0.735
15.37%
jan 1, 1996
7.87
+2.351
42.58%
jan 1, 1997
3.988
-3.882
-49.33%
jan 1, 1998
4.736
+0.748
18.75%
jan 1, 1999
5.31
+0.574
12.12%
jan 1, 2000
5.597
+0.287
5.41%
jan 1, 2001
5.538
-0.06
-1.06%
jan 1, 2002
5.841
+0.304
5.48%
jan 1, 2003
5.936
+0.095
1.62%
jan 1, 2004
6.417
+0.481
8.1%
jan 1, 2005
6.215
-0.202
-3.15%
jan 1, 2006
7.943
+1.728
27.8%
jan 1, 2007
8.547
+0.604
7.61%
jan 1, 2008
8.184
-0.363
-4.25%
jan 1, 2009
7.794
-0.39
-4.77%
jan 1, 2010
8.069
+0.276
3.54%
jan 1, 2011
9.123
+1.054
13.06%
jan 1, 2012
7.835
-1.288
-14.12%
jan 1, 2013
7.418
-0.417
-5.32%
jan 1, 2014
6.892
-0.526
-7.09%
jan 1, 2015
6.307
-0.585
-8.48%
jan 1, 2016
4.923
-1.385
-21.95%
Ranking of countries by current statistics by years


Comments: