29
/
en
AIzaSyAYiBZKx7MnpbEhh9jyipgxe19OcubqV5w
April 1, 2024
37462
IDA & IBRD total
IBT
false
2
1
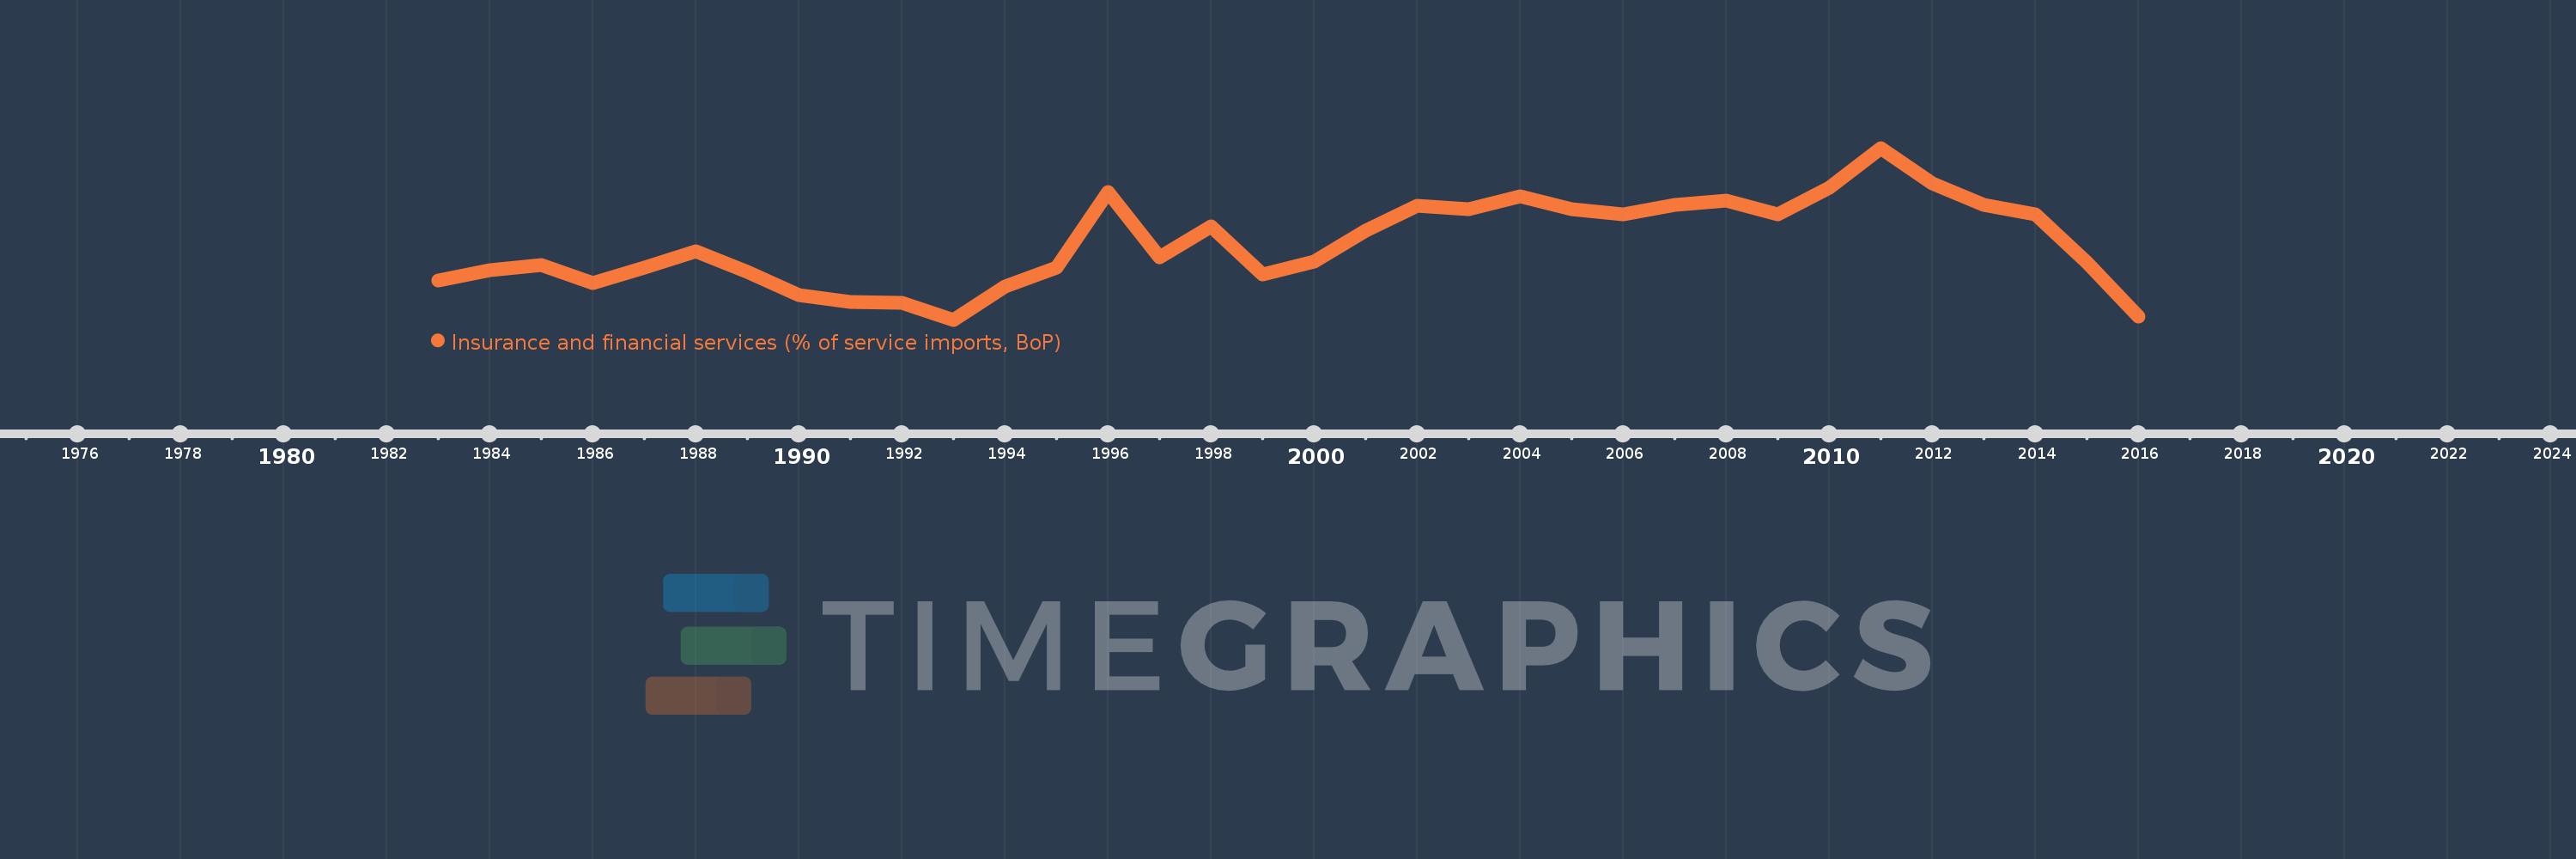
Insurance and financial services (% of service imports, BoP)
2016,2015,2014,2013,2012,2011,2010,2009,2008,2007,2006,2005,2004,2003,2002,2001,2000,1999,1998,1997,1996,1995,1994,1993,1992,1991,1990,1989,1988,1987,1986,1985,1984,1983
This statistics in other country:
AfghanistanAlbaniaAlgeriaAngolaAntigua and BarbudaArab WorldArgentinaArmeniaArubaAustraliaAustriaAzerbaijanBahamas, TheBahrainBangladeshBarbadosBelarusBelgiumBelizeBeninBermudaBhutanBoliviaBosnia and HerzegovinaBotswanaBrazilBrunei DarussalamBulgariaBurkina FasoBurundiCabo VerdeCambodiaCameroonCanadaCaribbean small statesCentral African RepublicCentral Europe and the BalticsChadChileChinaColombiaComorosCongo, Dem. Rep.Congo, Rep.Costa RicaCote d'IvoireCroatiaCuracaoCyprusCzech RepublicDenmarkDjiboutiDominicaDominican RepublicEarly-demographic dividendEast Asia & PacificEast Asia & Pacific (excluding high income)East Asia & Pacific (IDA & IBRD countries)EcuadorEgypt, Arab Rep.El SalvadorEquatorial GuineaEritreaEstoniaEthiopiaEuro areaEurope & Central AsiaEurope & Central Asia (excluding high income)Europe & Central Asia (IDA & IBRD countries)European UnionFaroe IslandsFijiFinlandFragile and conflict affected situationsFranceFrench PolynesiaGabonGambia, TheGeorgiaGermanyGhanaGreeceGrenadaGuatemalaGuineaGuinea-BissauGuyanaHaitiHeavily indebted poor countries (HIPC)High incomeHondurasHong Kong SAR, ChinaHungaryIBRD onlyIcelandIDA & IBRD totalIDA onlyIDA totalIndiaIndonesiaIran, Islamic Rep.IraqIrelandIsraelItalyJamaicaJapanJordanKazakhstanKenyaKiribatiKorea, Rep.KosovoKuwaitKyrgyz RepublicLao PDRLate-demographic dividendLatin America & Caribbean Latin America & Caribbean (excluding high income)Latin America & the Caribbean (IDA & IBRD countries)LatviaLeast developed countries: UN classificationLebanonLesothoLiberiaLibyaLithuaniaLow & middle incomeLow incomeLower middle incomeLuxembourgMacao SAR, ChinaMacedonia, FYRMadagascarMalawiMalaysiaMaldivesMaliMaltaMarshall IslandsMauritaniaMauritiusMexicoMicronesia, Fed. Sts.Middle East & North AfricaMiddle East & North Africa (excluding high income)Middle East & North Africa (IDA & IBRD countries)Middle incomeMoldovaMongoliaMontenegroMoroccoMozambiqueMyanmarNamibiaNepalNetherlandsNew CaledoniaNew ZealandNicaraguaNigerNigeriaNorth AmericaNorwayOECD membersOmanOther small statesPacific island small statesPakistanPalauPanamaPapua New GuineaParaguayPeruPhilippinesPolandPortugalPost-demographic dividendPre-demographic dividendQatarRomaniaRussian FederationRwandaSamoaSao Tome and PrincipeSaudi ArabiaSenegalSerbiaSeychellesSierra LeoneSingaporeSint Maarten (Dutch part)Slovak RepublicSloveniaSmall statesSolomon IslandsSouth AfricaSouth AsiaSouth Asia (IDA & IBRD)South SudanSpainSri LankaSt. Kitts and NevisSt. LuciaSt. Vincent and the GrenadinesSub-Saharan Africa Sub-Saharan Africa (excluding high income)Sub-Saharan Africa (IDA & IBRD countries)SudanSurinameSwazilandSwedenSwitzerlandSyrian Arab RepublicTajikistanTanzaniaThailandTimor-LesteTogoTongaTrinidad and TobagoTunisiaTurkeyTuvaluUgandaUkraineUnited KingdomUnited StatesUpper middle incomeUruguayVanuatuVenezuela, RBWest Bank and GazaWorldYemen, Rep.ZambiaZimbabwe Timeline:
This timeline shows a graph from 1983 to 2016 of IDA & IBRD total. No data until 1982. Number of actual observations by date: 34.
Source name:
World Development Indicators
Source organization:
International Monetary Fund, Balance of Payments Statistics Yearbook and data files.
Categories, topics:
Economy & Growth, Private Sector, Trade
Last updated:
apr 23, 2017
Indicators value changes by year
At the date of observation
Value
Absolute change
Change from previous value
jan 1, 1983
5.541
+5.541
0.0%
jan 1, 1984
5.734
+0.193
3.49%
jan 1, 1985
5.821
+0.087
1.52%
jan 1, 1986
5.504
-0.316
-5.44%
jan 1, 1987
5.781
+0.276
5.02%
jan 1, 1988
6.074
+0.294
5.08%
jan 1, 1989
5.703
-0.371
-6.11%
jan 1, 1990
5.279
-0.424
-7.43%
jan 1, 1991
5.161
-0.117
-2.23%
jan 1, 1992
5.142
-0.02
-0.38%
jan 1, 1993
4.843
-0.299
-5.81%
jan 1, 1994
5.438
+0.595
12.3%
jan 1, 1995
5.77
+0.331
6.09%
jan 1, 1996
7.126
+1.356
23.5%
jan 1, 1997
5.956
-1.17
-16.43%
jan 1, 1998
6.504
+0.549
9.22%
jan 1, 1999
5.656
-0.848
-13.04%
jan 1, 2000
5.883
+0.227
4.0%
jan 1, 2001
6.436
+0.554
9.41%
jan 1, 2002
6.882
+0.446
6.93%
jan 1, 2003
6.816
-0.066
-0.96%
jan 1, 2004
7.048
+0.232
3.41%
jan 1, 2005
6.826
-0.222
-3.15%
jan 1, 2006
6.719
-0.108
-1.58%
jan 1, 2007
6.89
+0.171
2.55%
jan 1, 2008
6.966
+0.076
1.1%
jan 1, 2009
6.722
-0.244
-3.5%
jan 1, 2010
7.202
+0.48
7.13%
jan 1, 2011
7.913
+0.711
9.87%
jan 1, 2012
7.28
-0.633
-8.0%
jan 1, 2013
6.89
-0.389
-5.35%
jan 1, 2014
6.732
-0.158
-2.29%
jan 1, 2015
5.868
-0.864
-12.84%
jan 1, 2016
4.9
-0.968
-16.5%
Ranking of countries by current statistics by years


Comments: