29
/
en
AIzaSyAYiBZKx7MnpbEhh9jyipgxe19OcubqV5w
April 1, 2024
161617
Italy
ITA
true
2
1
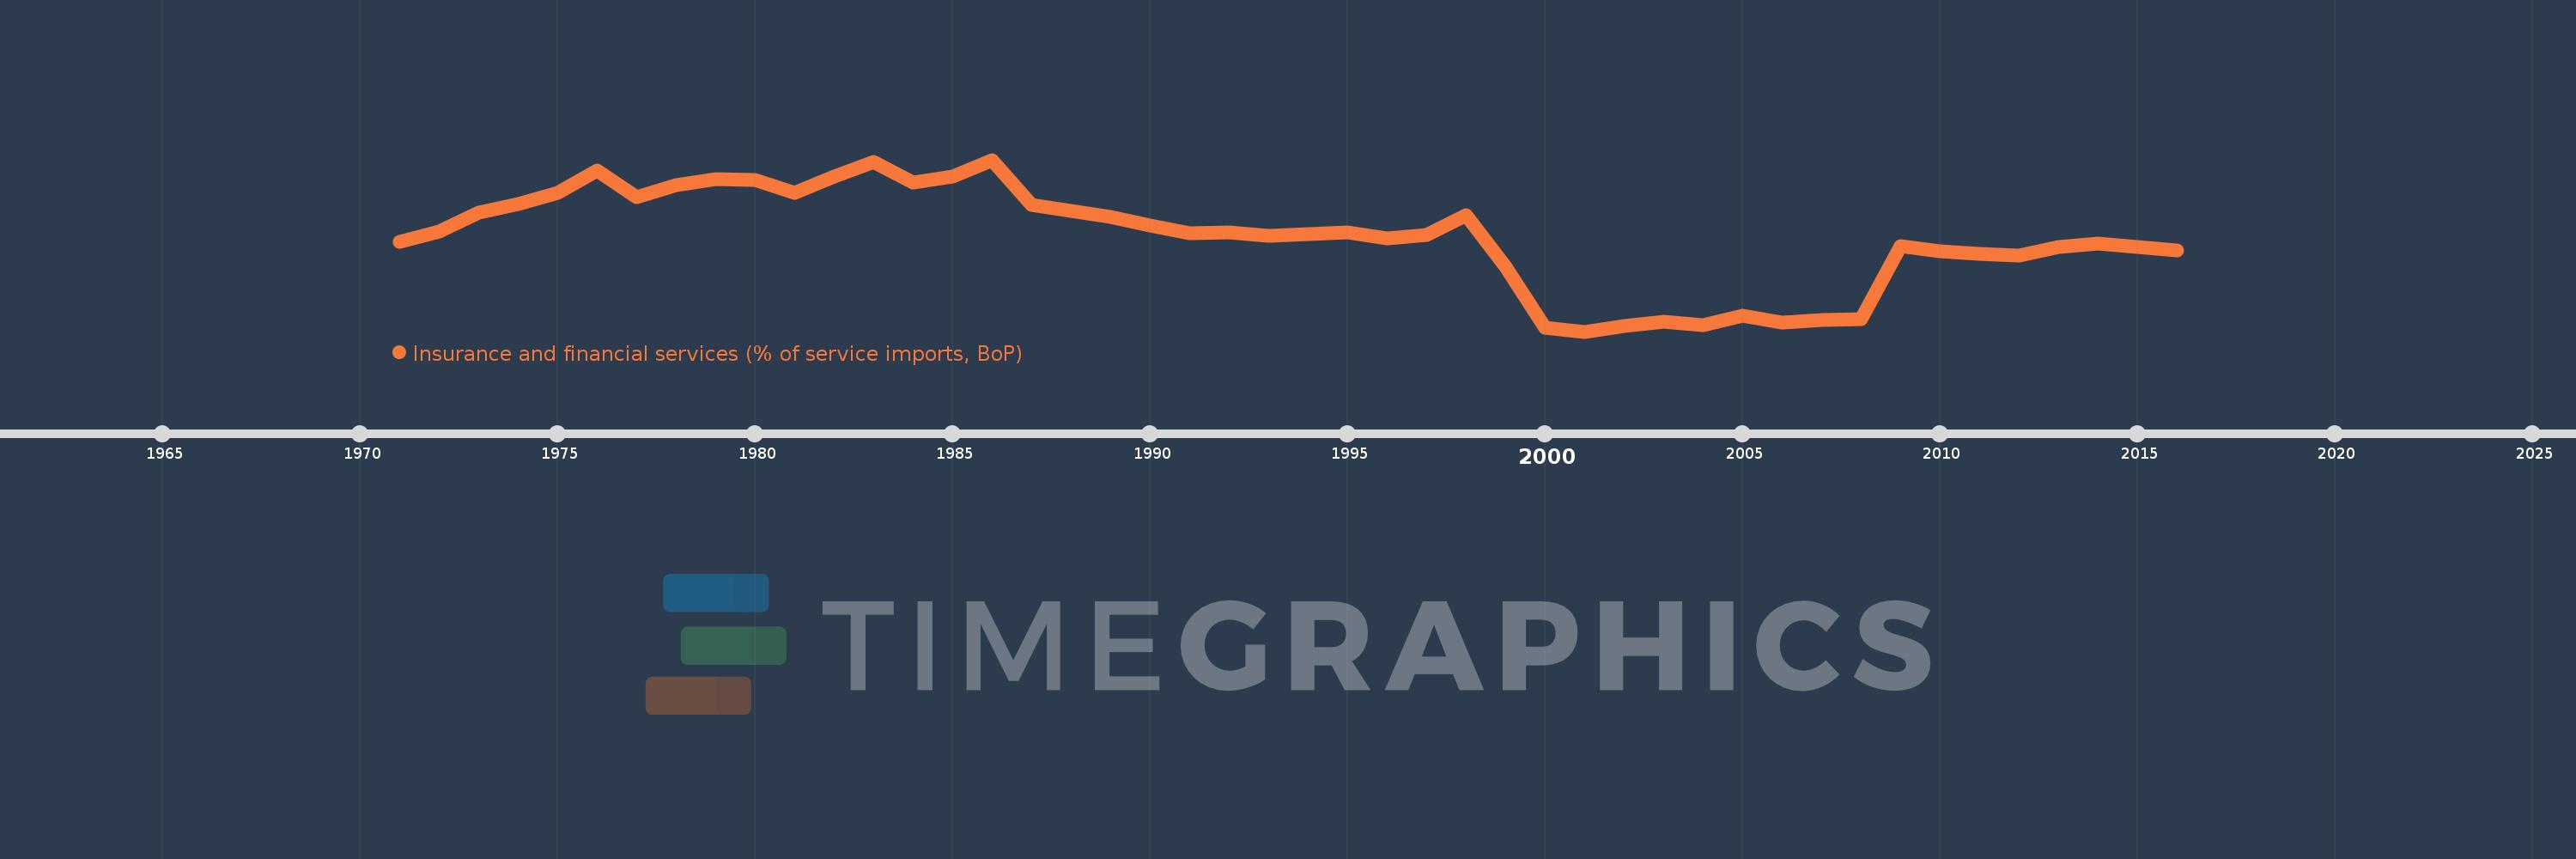
Insurance and financial services (% of service imports, BoP)
2016,2015,2014,2013,2012,2011,2010,2009,2008,2007,2006,2005,2004,2003,2002,2001,2000,1999,1998,1997,1996,1995,1994,1993,1992,1991,1990,1989,1988,1987,1986,1985,1984,1983,1982,1981,1980,1979,1978,1977,1976,1975,1974,1973,1972,1971
This statistics in other country:
AfghanistanAlbaniaAlgeriaAngolaAntigua and BarbudaArab WorldArgentinaArmeniaArubaAustraliaAustriaAzerbaijanBahamas, TheBahrainBangladeshBarbadosBelarusBelgiumBelizeBeninBermudaBhutanBoliviaBosnia and HerzegovinaBotswanaBrazilBrunei DarussalamBulgariaBurkina FasoBurundiCabo VerdeCambodiaCameroonCanadaCaribbean small statesCentral African RepublicCentral Europe and the BalticsChadChileChinaColombiaComorosCongo, Dem. Rep.Congo, Rep.Costa RicaCote d'IvoireCroatiaCuracaoCyprusCzech RepublicDenmarkDjiboutiDominicaDominican RepublicEarly-demographic dividendEast Asia & PacificEast Asia & Pacific (excluding high income)East Asia & Pacific (IDA & IBRD countries)EcuadorEgypt, Arab Rep.El SalvadorEquatorial GuineaEritreaEstoniaEthiopiaEuro areaEurope & Central AsiaEurope & Central Asia (excluding high income)Europe & Central Asia (IDA & IBRD countries)European UnionFaroe IslandsFijiFinlandFragile and conflict affected situationsFranceFrench PolynesiaGabonGambia, TheGeorgiaGermanyGhanaGreeceGrenadaGuatemalaGuineaGuinea-BissauGuyanaHaitiHeavily indebted poor countries (HIPC)High incomeHondurasHong Kong SAR, ChinaHungaryIBRD onlyIcelandIDA & IBRD totalIDA onlyIDA totalIndiaIndonesiaIran, Islamic Rep.IraqIrelandIsraelItalyJamaicaJapanJordanKazakhstanKenyaKiribatiKorea, Rep.KosovoKuwaitKyrgyz RepublicLao PDRLate-demographic dividendLatin America & Caribbean Latin America & Caribbean (excluding high income)Latin America & the Caribbean (IDA & IBRD countries)LatviaLeast developed countries: UN classificationLebanonLesothoLiberiaLibyaLithuaniaLow & middle incomeLow incomeLower middle incomeLuxembourgMacao SAR, ChinaMacedonia, FYRMadagascarMalawiMalaysiaMaldivesMaliMaltaMarshall IslandsMauritaniaMauritiusMexicoMicronesia, Fed. Sts.Middle East & North AfricaMiddle East & North Africa (excluding high income)Middle East & North Africa (IDA & IBRD countries)Middle incomeMoldovaMongoliaMontenegroMoroccoMozambiqueMyanmarNamibiaNepalNetherlandsNew CaledoniaNew ZealandNicaraguaNigerNigeriaNorth AmericaNorwayOECD membersOmanOther small statesPacific island small statesPakistanPalauPanamaPapua New GuineaParaguayPeruPhilippinesPolandPortugalPost-demographic dividendPre-demographic dividendQatarRomaniaRussian FederationRwandaSamoaSao Tome and PrincipeSaudi ArabiaSenegalSerbiaSeychellesSierra LeoneSingaporeSint Maarten (Dutch part)Slovak RepublicSloveniaSmall statesSolomon IslandsSouth AfricaSouth AsiaSouth Asia (IDA & IBRD)South SudanSpainSri LankaSt. Kitts and NevisSt. LuciaSt. Vincent and the GrenadinesSub-Saharan Africa Sub-Saharan Africa (excluding high income)Sub-Saharan Africa (IDA & IBRD countries)SudanSurinameSwazilandSwedenSwitzerlandSyrian Arab RepublicTajikistanTanzaniaThailandTimor-LesteTogoTongaTrinidad and TobagoTunisiaTurkeyTuvaluUgandaUkraineUnited KingdomUnited StatesUpper middle incomeUruguayVanuatuVenezuela, RBWest Bank and GazaWorldYemen, Rep.ZambiaZimbabwe Timeline:
This timeline shows a graph from 1971 to 2016 of Italy. No data until 1970. Number of actual observations by date: 46.
Source name:
World Development Indicators
Source organization:
International Monetary Fund, Balance of Payments Statistics Yearbook and data files.
Categories, topics:
Economy & Growth, Private Sector, Trade
Last updated:
apr 23, 2017
Indicators value changes by year
At the date of observation
Value
Absolute change
Change from previous value
jan 1, 1971
10.455
+10.455
0.0%
jan 1, 1972
11.279
+0.824
7.88%
jan 1, 1973
12.906
+1.627
14.43%
jan 1, 1974
13.588
+0.683
5.29%
jan 1, 1975
14.495
+0.907
6.67%
jan 1, 1976
16.35
+1.855
12.8%
jan 1, 1977
14.131
-2.219
-13.57%
jan 1, 1978
15.131
+1.0
7.08%
jan 1, 1979
15.694
+0.563
3.72%
jan 1, 1980
15.599
-0.095
-0.61%
jan 1, 1981
14.551
-1.048
-6.72%
jan 1, 1982
15.869
+1.318
9.06%
jan 1, 1983
17.114
+1.245
7.84%
jan 1, 1984
15.366
-1.748
-10.21%
jan 1, 1985
15.856
+0.491
3.19%
jan 1, 1986
17.28
+1.424
8.98%
jan 1, 1987
13.548
-3.733
-21.6%
jan 1, 1988
13.01
-0.537
-3.97%
jan 1, 1989
12.53
-0.48
-3.69%
jan 1, 1990
11.777
-0.753
-6.01%
jan 1, 1991
11.157
-0.621
-5.27%
jan 1, 1992
11.229
+0.073
0.65%
jan 1, 1993
10.93
-0.299
-2.66%
jan 1, 1994
11.096
+0.166
1.52%
jan 1, 1995
11.22
+0.123
1.11%
jan 1, 1996
10.732
-0.487
-4.34%
jan 1, 1997
10.981
+0.248
2.31%
jan 1, 1998
12.674
+1.693
15.42%
jan 1, 1999
8.349
-4.325
-34.13%
jan 1, 2000
3.232
-5.117
-61.29%
jan 1, 2001
2.94
-0.292
-9.03%
jan 1, 2002
3.436
+0.496
16.85%
jan 1, 2003
3.791
+0.355
10.33%
jan 1, 2004
3.474
-0.316
-8.34%
jan 1, 2005
4.279
+0.804
23.15%
jan 1, 2006
3.714
-0.565
-13.2%
jan 1, 2007
3.88
+0.166
4.47%
jan 1, 2008
3.968
+0.087
2.25%
jan 1, 2009
10.049
+6.082
153.28%
jan 1, 2010
9.645
-0.404
-4.02%
jan 1, 2011
9.394
-0.251
-2.6%
jan 1, 2012
9.269
-0.125
-1.33%
jan 1, 2013
10.016
+0.747
8.06%
jan 1, 2014
10.322
+0.306
3.06%
jan 1, 2015
10.037
-0.286
-2.77%
jan 1, 2016
9.735
-0.302
-3.01%
Ranking of countries by current statistics by years


Comments: