29
/
en
AIzaSyAYiBZKx7MnpbEhh9jyipgxe19OcubqV5w
April 1, 2024
126343
El Salvador
SLV
true
2
1
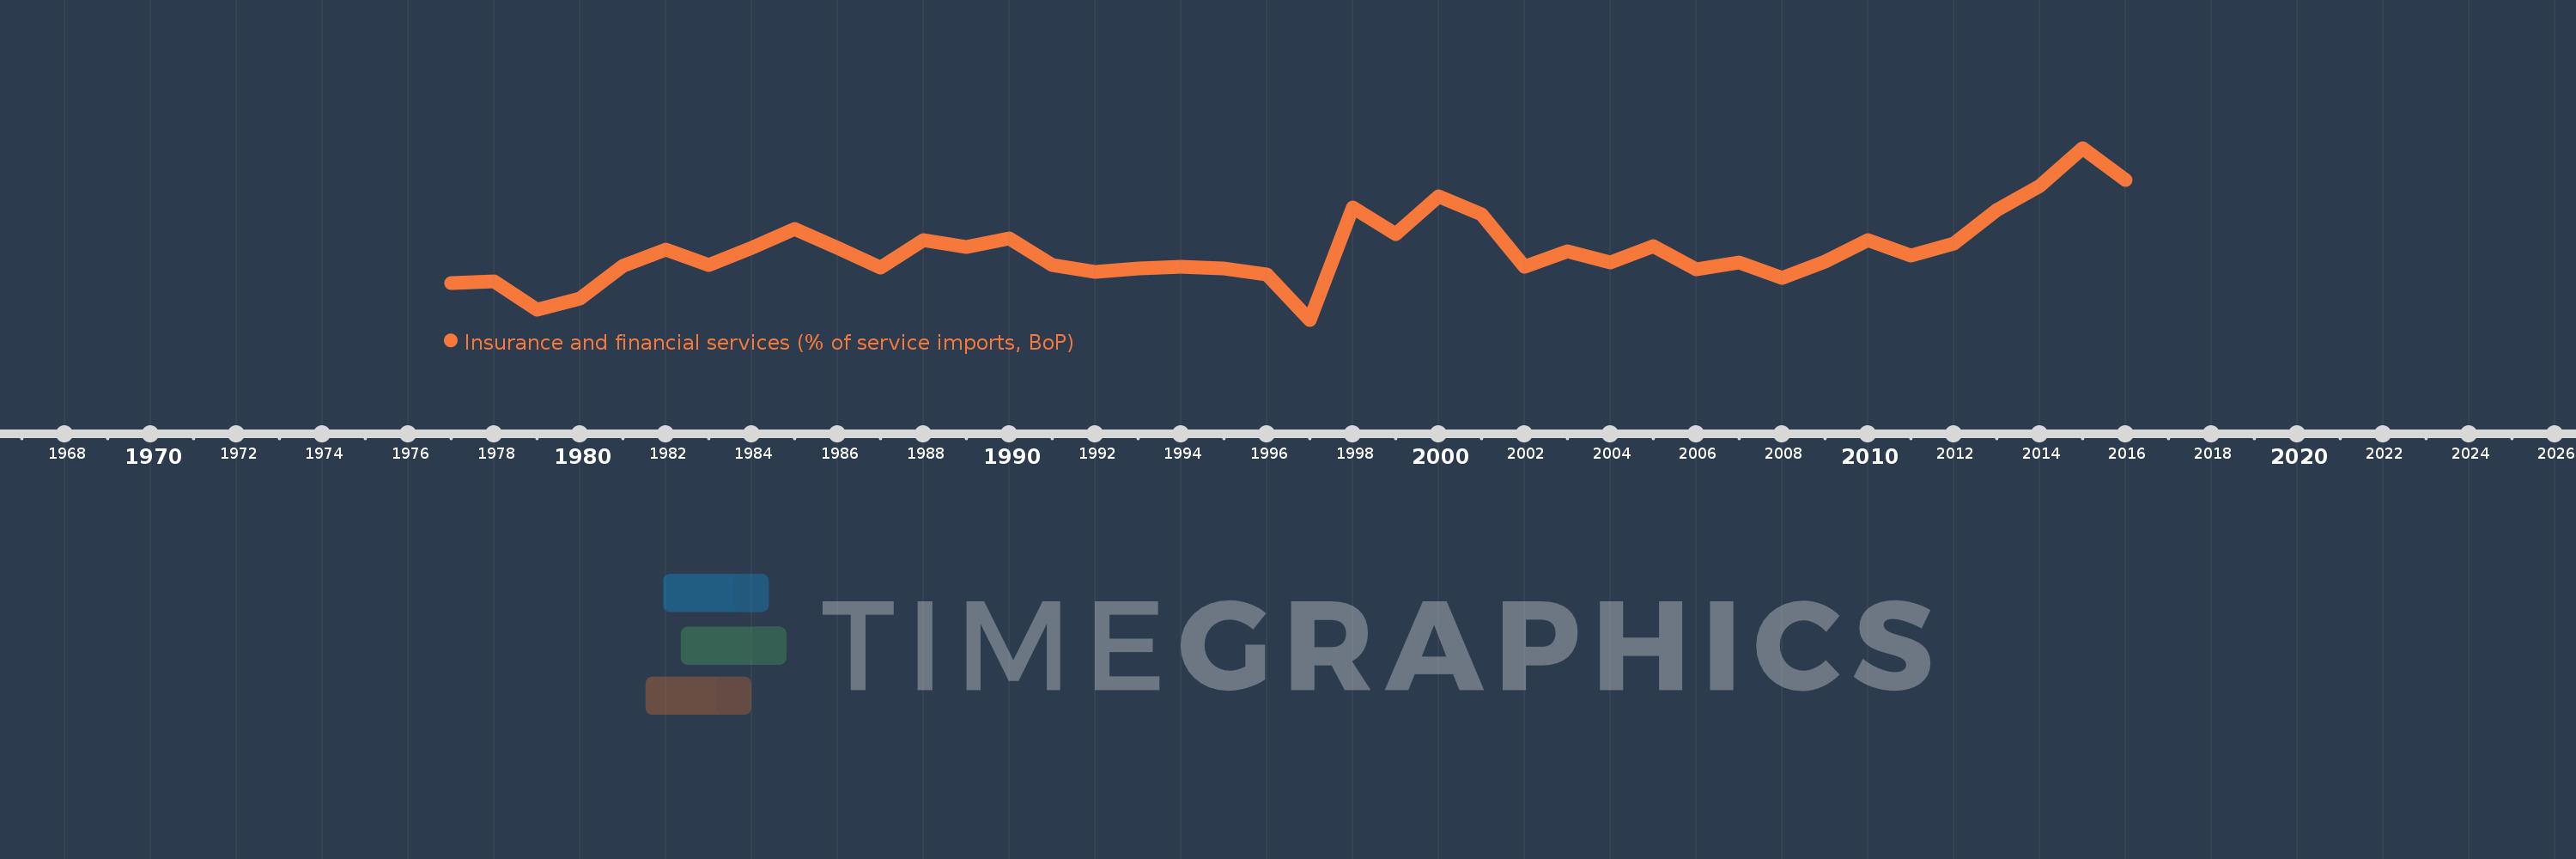
Insurance and financial services (% of service imports, BoP)
2016,2015,2014,2013,2012,2011,2010,2009,2008,2007,2006,2005,2004,2003,2002,2001,2000,1999,1998,1997,1996,1995,1994,1993,1992,1991,1990,1989,1988,1987,1986,1985,1984,1983,1982,1981,1980,1979,1978,1977
This statistics in other country:
AfghanistanAlbaniaAlgeriaAngolaAntigua and BarbudaArab WorldArgentinaArmeniaArubaAustraliaAustriaAzerbaijanBahamas, TheBahrainBangladeshBarbadosBelarusBelgiumBelizeBeninBermudaBhutanBoliviaBosnia and HerzegovinaBotswanaBrazilBrunei DarussalamBulgariaBurkina FasoBurundiCabo VerdeCambodiaCameroonCanadaCaribbean small statesCentral African RepublicCentral Europe and the BalticsChadChileChinaColombiaComorosCongo, Dem. Rep.Congo, Rep.Costa RicaCote d'IvoireCroatiaCuracaoCyprusCzech RepublicDenmarkDjiboutiDominicaDominican RepublicEarly-demographic dividendEast Asia & PacificEast Asia & Pacific (excluding high income)East Asia & Pacific (IDA & IBRD countries)EcuadorEgypt, Arab Rep.El SalvadorEquatorial GuineaEritreaEstoniaEthiopiaEuro areaEurope & Central AsiaEurope & Central Asia (excluding high income)Europe & Central Asia (IDA & IBRD countries)European UnionFaroe IslandsFijiFinlandFragile and conflict affected situationsFranceFrench PolynesiaGabonGambia, TheGeorgiaGermanyGhanaGreeceGrenadaGuatemalaGuineaGuinea-BissauGuyanaHaitiHeavily indebted poor countries (HIPC)High incomeHondurasHong Kong SAR, ChinaHungaryIBRD onlyIcelandIDA & IBRD totalIDA onlyIDA totalIndiaIndonesiaIran, Islamic Rep.IraqIrelandIsraelItalyJamaicaJapanJordanKazakhstanKenyaKiribatiKorea, Rep.KosovoKuwaitKyrgyz RepublicLao PDRLate-demographic dividendLatin America & Caribbean Latin America & Caribbean (excluding high income)Latin America & the Caribbean (IDA & IBRD countries)LatviaLeast developed countries: UN classificationLebanonLesothoLiberiaLibyaLithuaniaLow & middle incomeLow incomeLower middle incomeLuxembourgMacao SAR, ChinaMacedonia, FYRMadagascarMalawiMalaysiaMaldivesMaliMaltaMarshall IslandsMauritaniaMauritiusMexicoMicronesia, Fed. Sts.Middle East & North AfricaMiddle East & North Africa (excluding high income)Middle East & North Africa (IDA & IBRD countries)Middle incomeMoldovaMongoliaMontenegroMoroccoMozambiqueMyanmarNamibiaNepalNetherlandsNew CaledoniaNew ZealandNicaraguaNigerNigeriaNorth AmericaNorwayOECD membersOmanOther small statesPacific island small statesPakistanPalauPanamaPapua New GuineaParaguayPeruPhilippinesPolandPortugalPost-demographic dividendPre-demographic dividendQatarRomaniaRussian FederationRwandaSamoaSao Tome and PrincipeSaudi ArabiaSenegalSerbiaSeychellesSierra LeoneSingaporeSint Maarten (Dutch part)Slovak RepublicSloveniaSmall statesSolomon IslandsSouth AfricaSouth AsiaSouth Asia (IDA & IBRD)South SudanSpainSri LankaSt. Kitts and NevisSt. LuciaSt. Vincent and the GrenadinesSub-Saharan Africa Sub-Saharan Africa (excluding high income)Sub-Saharan Africa (IDA & IBRD countries)SudanSurinameSwazilandSwedenSwitzerlandSyrian Arab RepublicTajikistanTanzaniaThailandTimor-LesteTogoTongaTrinidad and TobagoTunisiaTurkeyTuvaluUgandaUkraineUnited KingdomUnited StatesUpper middle incomeUruguayVanuatuVenezuela, RBWest Bank and GazaWorldYemen, Rep.ZambiaZimbabwe Timeline:
This timeline shows a graph from 1977 to 2016 of El Salvador. No data until 1976. Number of actual observations by date: 40.
Source name:
World Development Indicators
Source organization:
International Monetary Fund, Balance of Payments Statistics Yearbook and data files.
Categories, topics:
Economy & Growth, Private Sector, Trade
Last updated:
apr 23, 2017
Indicators value changes by year
Maximum:
21.181
jan 1, 2015
At the date of observation
Value
Absolute change
Change from previous value
jan 1, 1977
9.799
+9.799
0.0%
jan 1, 1978
9.969
+0.17
1.73%
jan 1, 1979
7.6
-2.369
-23.77%
jan 1, 1980
8.515
+0.915
12.04%
jan 1, 1981
11.248
+2.732
32.09%
jan 1, 1982
12.665
+1.418
12.6%
jan 1, 1983
11.334
-1.331
-10.51%
jan 1, 1984
12.798
+1.464
12.92%
jan 1, 1985
14.399
+1.601
12.51%
jan 1, 1986
12.808
-1.591
-11.05%
jan 1, 1987
11.162
-1.646
-12.85%
jan 1, 1988
13.409
+2.248
20.14%
jan 1, 1989
12.882
-0.527
-3.93%
jan 1, 1990
13.612
+0.73
5.67%
jan 1, 1991
11.332
-2.281
-16.75%
jan 1, 1992
10.799
-0.533
-4.71%
jan 1, 1993
11.086
+0.287
2.66%
jan 1, 1994
11.174
+0.088
0.8%
jan 1, 1995
11.058
-0.116
-1.04%
jan 1, 1996
10.553
-0.504
-4.56%
jan 1, 1997
6.745
-3.808
-36.09%
jan 1, 1998
16.202
+9.457
140.21%
jan 1, 1999
13.922
-2.28
-14.07%
jan 1, 2000
17.138
+3.216
23.1%
jan 1, 2001
15.616
-1.522
-8.88%
jan 1, 2002
11.192
-4.424
-28.33%
jan 1, 2003
12.489
+1.298
11.59%
jan 1, 2004
11.542
-0.947
-7.59%
jan 1, 2005
12.895
+1.353
11.72%
jan 1, 2006
10.962
-1.933
-14.99%
jan 1, 2007
11.585
+0.623
5.68%
jan 1, 2008
10.286
-1.3
-11.22%
jan 1, 2009
11.626
+1.34
13.03%
jan 1, 2010
13.436
+1.81
15.57%
jan 1, 2011
12.122
-1.314
-9.78%
jan 1, 2012
13.114
+0.992
8.18%
jan 1, 2013
15.973
+2.859
21.8%
jan 1, 2014
17.987
+2.014
12.61%
jan 1, 2015
21.181
+3.194
17.76%
jan 1, 2016
18.523
-2.658
-12.55%
Ranking of countries by current statistics by years


Comments: