29
/
en
AIzaSyAYiBZKx7MnpbEhh9jyipgxe19OcubqV5w
April 1, 2024
222349
Peru
PER
true
2
1
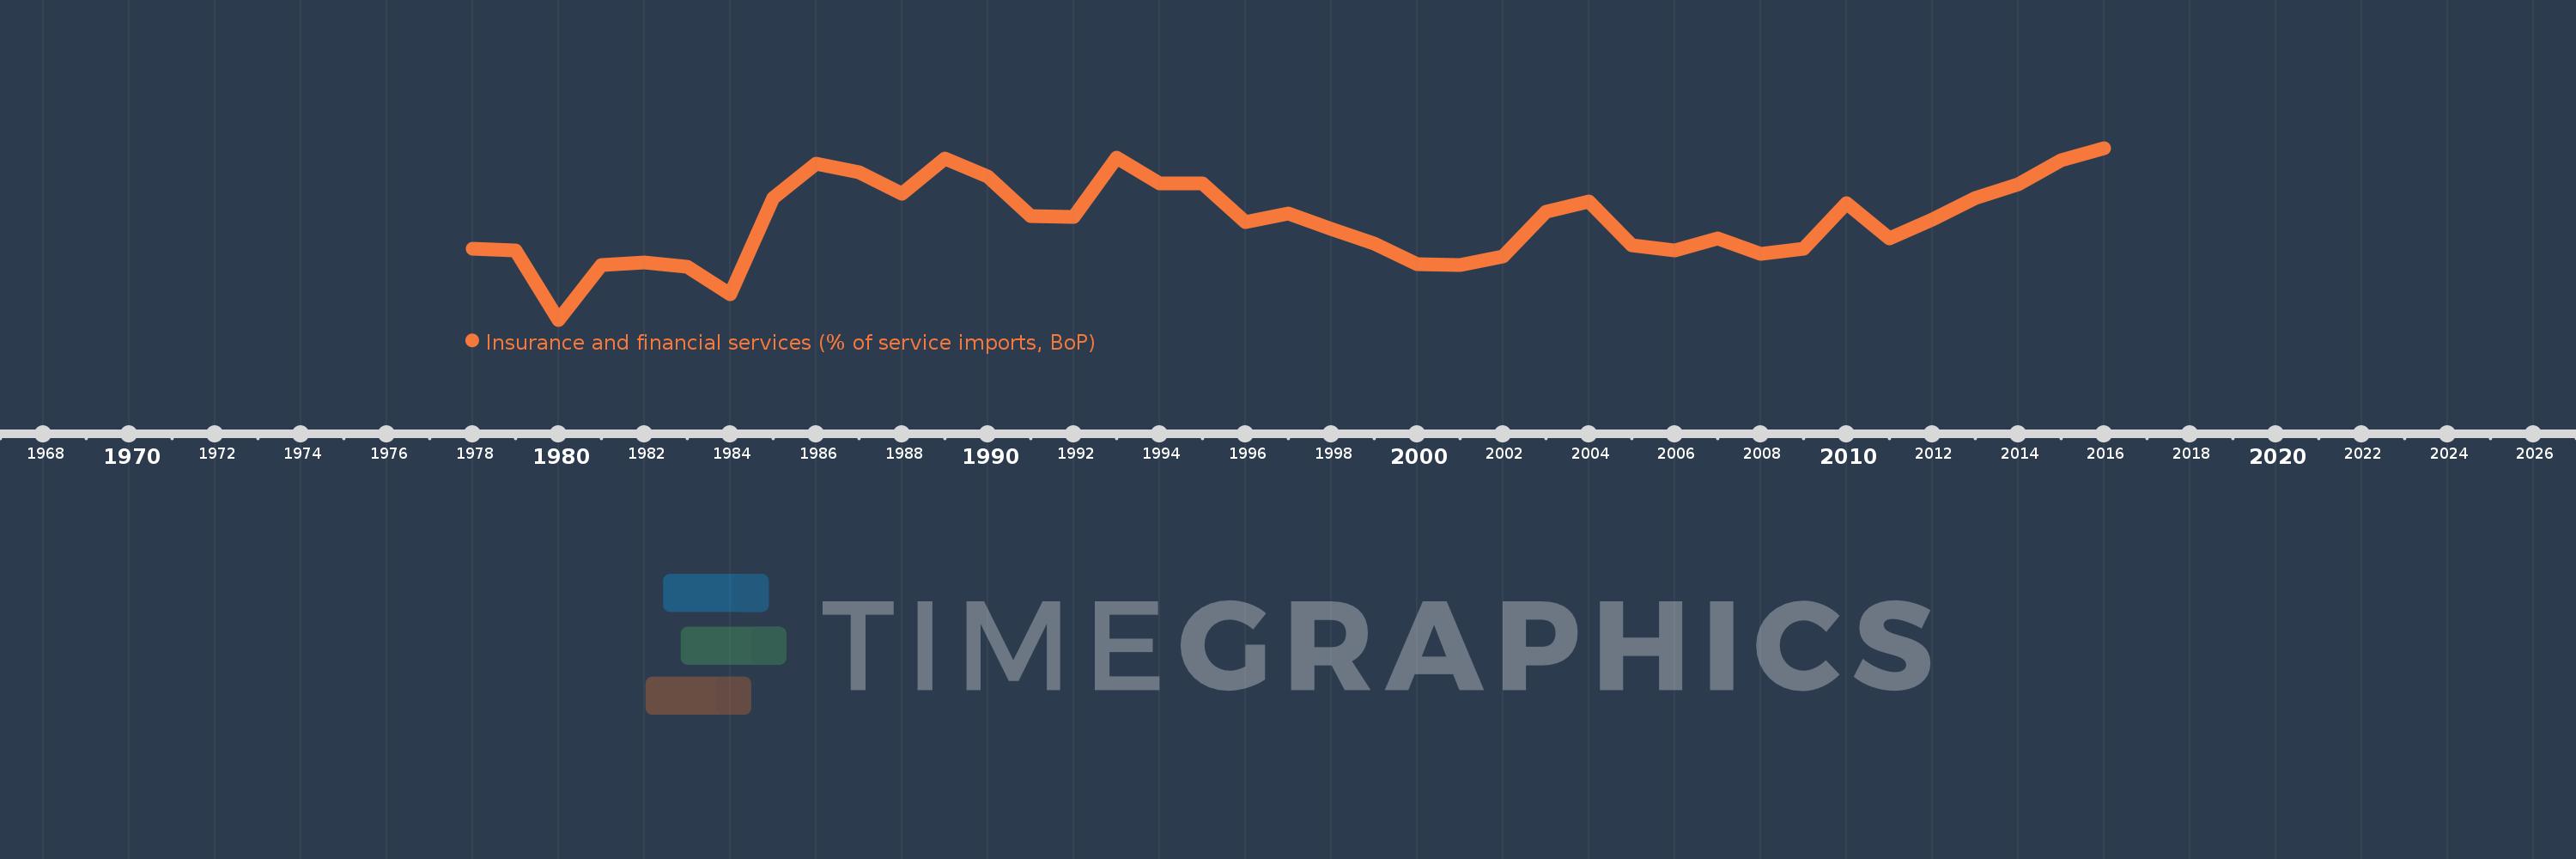
Insurance and financial services (% of service imports, BoP)
2016,2015,2014,2013,2012,2011,2010,2009,2008,2007,2006,2005,2004,2003,2002,2001,2000,1999,1998,1997,1996,1995,1994,1993,1992,1991,1990,1989,1988,1987,1986,1985,1984,1983,1982,1981,1980,1979,1978
This statistics in other country:
AfghanistanAlbaniaAlgeriaAngolaAntigua and BarbudaArab WorldArgentinaArmeniaArubaAustraliaAustriaAzerbaijanBahamas, TheBahrainBangladeshBarbadosBelarusBelgiumBelizeBeninBermudaBhutanBoliviaBosnia and HerzegovinaBotswanaBrazilBrunei DarussalamBulgariaBurkina FasoBurundiCabo VerdeCambodiaCameroonCanadaCaribbean small statesCentral African RepublicCentral Europe and the BalticsChadChileChinaColombiaComorosCongo, Dem. Rep.Congo, Rep.Costa RicaCote d'IvoireCroatiaCuracaoCyprusCzech RepublicDenmarkDjiboutiDominicaDominican RepublicEarly-demographic dividendEast Asia & PacificEast Asia & Pacific (excluding high income)East Asia & Pacific (IDA & IBRD countries)EcuadorEgypt, Arab Rep.El SalvadorEquatorial GuineaEritreaEstoniaEthiopiaEuro areaEurope & Central AsiaEurope & Central Asia (excluding high income)Europe & Central Asia (IDA & IBRD countries)European UnionFaroe IslandsFijiFinlandFragile and conflict affected situationsFranceFrench PolynesiaGabonGambia, TheGeorgiaGermanyGhanaGreeceGrenadaGuatemalaGuineaGuinea-BissauGuyanaHaitiHeavily indebted poor countries (HIPC)High incomeHondurasHong Kong SAR, ChinaHungaryIBRD onlyIcelandIDA & IBRD totalIDA onlyIDA totalIndiaIndonesiaIran, Islamic Rep.IraqIrelandIsraelItalyJamaicaJapanJordanKazakhstanKenyaKiribatiKorea, Rep.KosovoKuwaitKyrgyz RepublicLao PDRLate-demographic dividendLatin America & Caribbean Latin America & Caribbean (excluding high income)Latin America & the Caribbean (IDA & IBRD countries)LatviaLeast developed countries: UN classificationLebanonLesothoLiberiaLibyaLithuaniaLow & middle incomeLow incomeLower middle incomeLuxembourgMacao SAR, ChinaMacedonia, FYRMadagascarMalawiMalaysiaMaldivesMaliMaltaMarshall IslandsMauritaniaMauritiusMexicoMicronesia, Fed. Sts.Middle East & North AfricaMiddle East & North Africa (excluding high income)Middle East & North Africa (IDA & IBRD countries)Middle incomeMoldovaMongoliaMontenegroMoroccoMozambiqueMyanmarNamibiaNepalNetherlandsNew CaledoniaNew ZealandNicaraguaNigerNigeriaNorth AmericaNorwayOECD membersOmanOther small statesPacific island small statesPakistanPalauPanamaPapua New GuineaParaguayPeruPhilippinesPolandPortugalPost-demographic dividendPre-demographic dividendQatarRomaniaRussian FederationRwandaSamoaSao Tome and PrincipeSaudi ArabiaSenegalSerbiaSeychellesSierra LeoneSingaporeSint Maarten (Dutch part)Slovak RepublicSloveniaSmall statesSolomon IslandsSouth AfricaSouth AsiaSouth Asia (IDA & IBRD)South SudanSpainSri LankaSt. Kitts and NevisSt. LuciaSt. Vincent and the GrenadinesSub-Saharan Africa Sub-Saharan Africa (excluding high income)Sub-Saharan Africa (IDA & IBRD countries)SudanSurinameSwazilandSwedenSwitzerlandSyrian Arab RepublicTajikistanTanzaniaThailandTimor-LesteTogoTongaTrinidad and TobagoTunisiaTurkeyTuvaluUgandaUkraineUnited KingdomUnited StatesUpper middle incomeUruguayVanuatuVenezuela, RBWest Bank and GazaWorldYemen, Rep.ZambiaZimbabwe Timeline:
This timeline shows a graph from 1978 to 2016 of Peru. No data until 1977. Number of actual observations by date: 39.
Source name:
World Development Indicators
Source organization:
International Monetary Fund, Balance of Payments Statistics Yearbook and data files.
Categories, topics:
Economy & Growth, Private Sector, Trade
Last updated:
apr 23, 2017
Indicators value changes by year
Maximum:
13.957
jan 1, 2016
At the date of observation
Value
Absolute change
Change from previous value
jan 1, 1978
8.142
+8.142
0.0%
jan 1, 1979
8.049
-0.093
-1.14%
jan 1, 1980
4.036
-4.013
-49.85%
jan 1, 1981
7.207
+3.171
78.55%
jan 1, 1982
7.36
+0.153
2.12%
jan 1, 1983
7.104
-0.256
-3.48%
jan 1, 1984
5.492
-1.612
-22.69%
jan 1, 1985
11.045
+5.553
101.1%
jan 1, 1986
13.062
+2.017
18.26%
jan 1, 1987
12.533
-0.529
-4.05%
jan 1, 1988
11.292
-1.241
-9.9%
jan 1, 1989
13.335
+2.043
18.09%
jan 1, 1990
12.304
-1.031
-7.73%
jan 1, 1991
10.0
-2.304
-18.72%
jan 1, 1992
9.984
-0.016
-0.16%
jan 1, 1993
13.38
+3.396
34.02%
jan 1, 1994
11.905
-1.475
-11.03%
jan 1, 1995
11.933
+0.028
0.24%
jan 1, 1996
9.697
-2.236
-18.74%
jan 1, 1997
10.196
+0.499
5.15%
jan 1, 1998
9.285
-0.911
-8.94%
jan 1, 1999
8.451
-0.834
-8.98%
jan 1, 2000
7.228
-1.223
-14.48%
jan 1, 2001
7.214
-0.014
-0.19%
jan 1, 2002
7.698
+0.484
6.71%
jan 1, 2003
10.265
+2.566
33.34%
jan 1, 2004
10.867
+0.603
5.87%
jan 1, 2005
8.351
-2.516
-23.15%
jan 1, 2006
8.049
-0.303
-3.62%
jan 1, 2007
8.722
+0.674
8.37%
jan 1, 2008
7.825
-0.897
-10.28%
jan 1, 2009
8.139
+0.314
4.01%
jan 1, 2010
10.768
+2.629
32.3%
jan 1, 2011
8.752
-2.016
-18.72%
jan 1, 2012
9.839
+1.087
12.42%
jan 1, 2013
11.088
+1.249
12.7%
jan 1, 2014
11.875
+0.787
7.09%
jan 1, 2015
13.252
+1.378
11.6%
jan 1, 2016
13.957
+0.704
5.31%
Ranking of countries by current statistics by years


Comments: