29
/
en
AIzaSyAYiBZKx7MnpbEhh9jyipgxe19OcubqV5w
April 1, 2024
214458
Norway
NOR
true
2
1
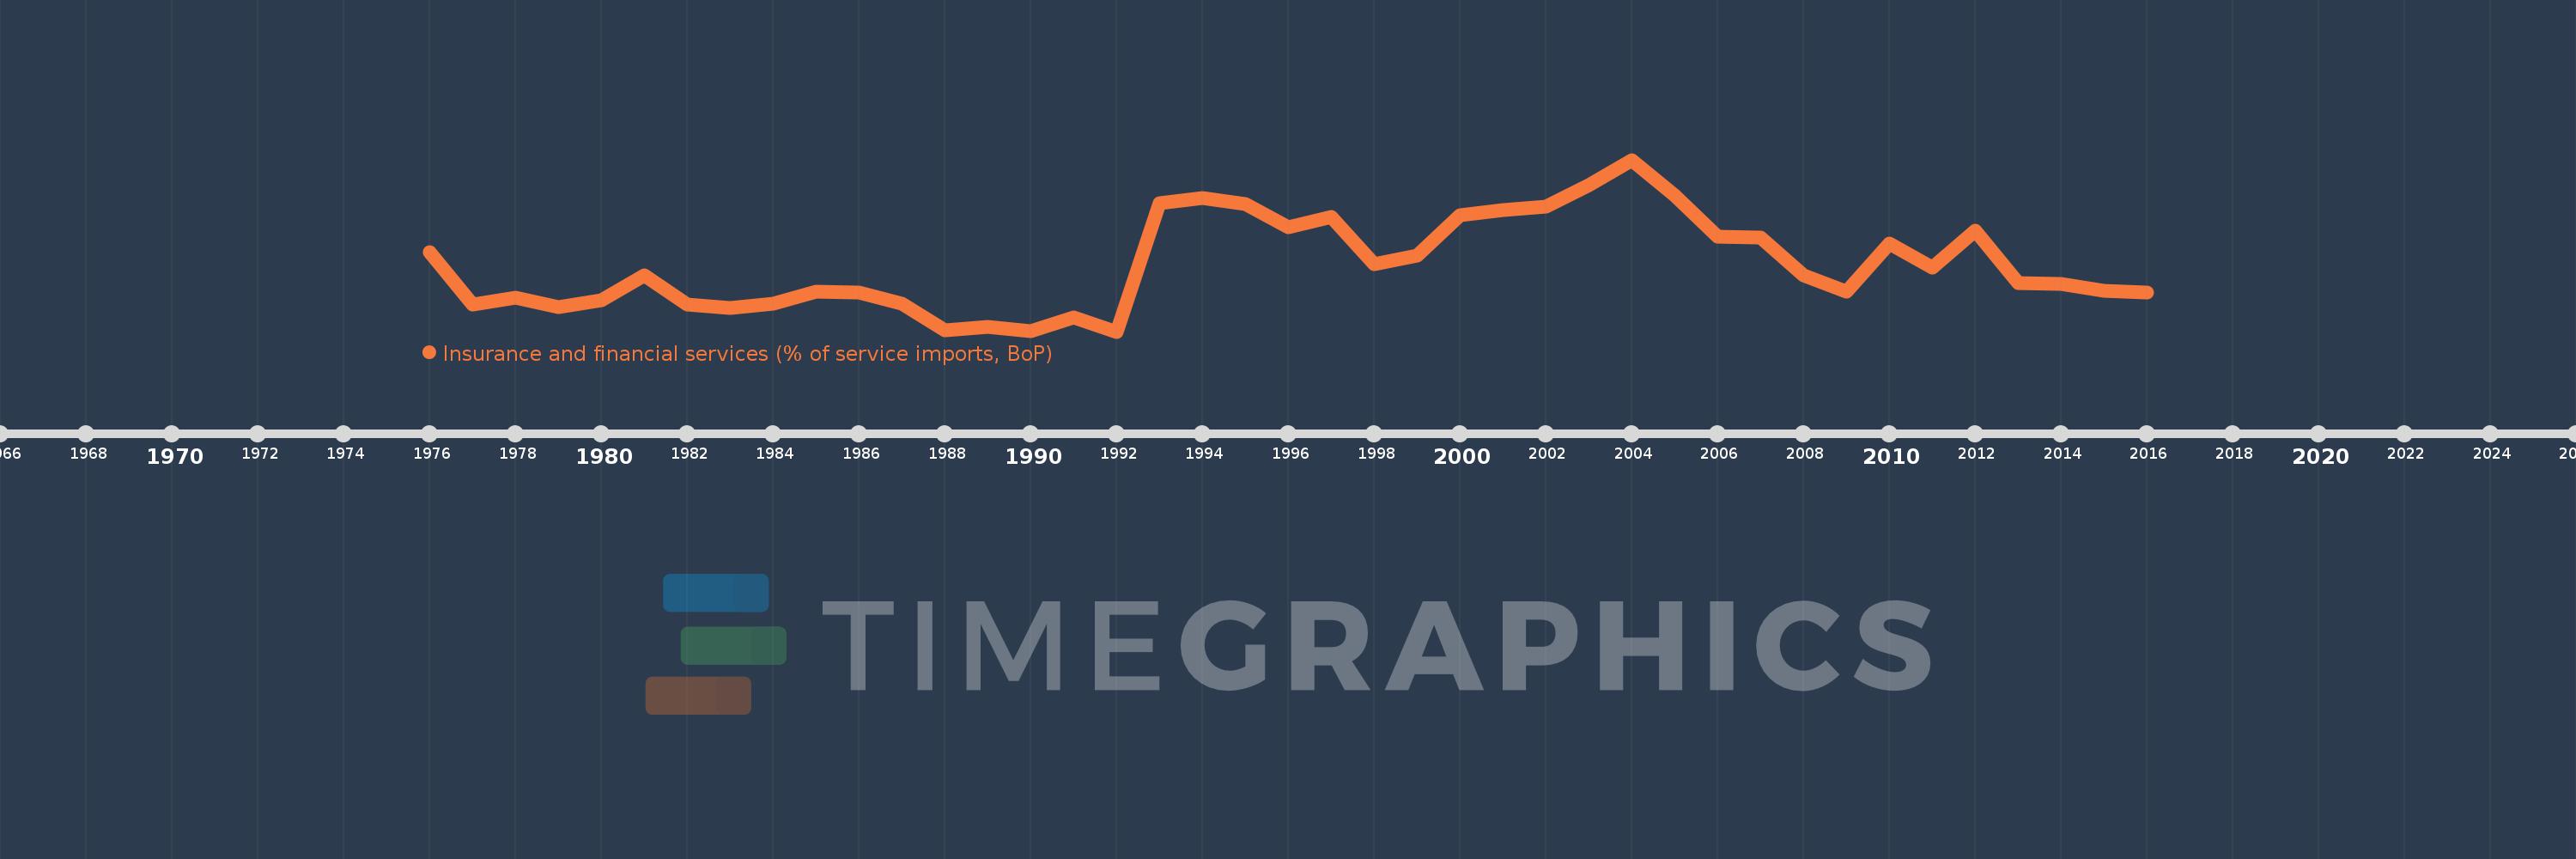
Insurance and financial services (% of service imports, BoP)
2016,2015,2014,2013,2012,2011,2010,2009,2008,2007,2006,2005,2004,2003,2002,2001,2000,1999,1998,1997,1996,1995,1994,1993,1992,1991,1990,1989,1988,1987,1986,1985,1984,1983,1982,1981,1980,1979,1978,1977,1976
This statistics in other country:
AfghanistanAlbaniaAlgeriaAngolaAntigua and BarbudaArab WorldArgentinaArmeniaArubaAustraliaAustriaAzerbaijanBahamas, TheBahrainBangladeshBarbadosBelarusBelgiumBelizeBeninBermudaBhutanBoliviaBosnia and HerzegovinaBotswanaBrazilBrunei DarussalamBulgariaBurkina FasoBurundiCabo VerdeCambodiaCameroonCanadaCaribbean small statesCentral African RepublicCentral Europe and the BalticsChadChileChinaColombiaComorosCongo, Dem. Rep.Congo, Rep.Costa RicaCote d'IvoireCroatiaCuracaoCyprusCzech RepublicDenmarkDjiboutiDominicaDominican RepublicEarly-demographic dividendEast Asia & PacificEast Asia & Pacific (excluding high income)East Asia & Pacific (IDA & IBRD countries)EcuadorEgypt, Arab Rep.El SalvadorEquatorial GuineaEritreaEstoniaEthiopiaEuro areaEurope & Central AsiaEurope & Central Asia (excluding high income)Europe & Central Asia (IDA & IBRD countries)European UnionFaroe IslandsFijiFinlandFragile and conflict affected situationsFranceFrench PolynesiaGabonGambia, TheGeorgiaGermanyGhanaGreeceGrenadaGuatemalaGuineaGuinea-BissauGuyanaHaitiHeavily indebted poor countries (HIPC)High incomeHondurasHong Kong SAR, ChinaHungaryIBRD onlyIcelandIDA & IBRD totalIDA onlyIDA totalIndiaIndonesiaIran, Islamic Rep.IraqIrelandIsraelItalyJamaicaJapanJordanKazakhstanKenyaKiribatiKorea, Rep.KosovoKuwaitKyrgyz RepublicLao PDRLate-demographic dividendLatin America & Caribbean Latin America & Caribbean (excluding high income)Latin America & the Caribbean (IDA & IBRD countries)LatviaLeast developed countries: UN classificationLebanonLesothoLiberiaLibyaLithuaniaLow & middle incomeLow incomeLower middle incomeLuxembourgMacao SAR, ChinaMacedonia, FYRMadagascarMalawiMalaysiaMaldivesMaliMaltaMarshall IslandsMauritaniaMauritiusMexicoMicronesia, Fed. Sts.Middle East & North AfricaMiddle East & North Africa (excluding high income)Middle East & North Africa (IDA & IBRD countries)Middle incomeMoldovaMongoliaMontenegroMoroccoMozambiqueMyanmarNamibiaNepalNetherlandsNew CaledoniaNew ZealandNicaraguaNigerNigeriaNorth AmericaNorwayOECD membersOmanOther small statesPacific island small statesPakistanPalauPanamaPapua New GuineaParaguayPeruPhilippinesPolandPortugalPost-demographic dividendPre-demographic dividendQatarRomaniaRussian FederationRwandaSamoaSao Tome and PrincipeSaudi ArabiaSenegalSerbiaSeychellesSierra LeoneSingaporeSint Maarten (Dutch part)Slovak RepublicSloveniaSmall statesSolomon IslandsSouth AfricaSouth AsiaSouth Asia (IDA & IBRD)South SudanSpainSri LankaSt. Kitts and NevisSt. LuciaSt. Vincent and the GrenadinesSub-Saharan Africa Sub-Saharan Africa (excluding high income)Sub-Saharan Africa (IDA & IBRD countries)SudanSurinameSwazilandSwedenSwitzerlandSyrian Arab RepublicTajikistanTanzaniaThailandTimor-LesteTogoTongaTrinidad and TobagoTunisiaTurkeyTuvaluUgandaUkraineUnited KingdomUnited StatesUpper middle incomeUruguayVanuatuVenezuela, RBWest Bank and GazaWorldYemen, Rep.ZambiaZimbabwe Timeline:
This timeline shows a graph from 1976 to 2016 of Norway. No data until 1975. Number of actual observations by date: 41.
Source name:
World Development Indicators
Source organization:
International Monetary Fund, Balance of Payments Statistics Yearbook and data files.
Categories, topics:
Economy & Growth, Private Sector, Trade
Last updated:
apr 23, 2017
Indicators value changes by year
At the date of observation
Value
Absolute change
Change from previous value
jan 1, 1976
4.272
+4.272
0.0%
jan 1, 1977
2.192
-2.08
-48.69%
jan 1, 1978
2.467
+0.275
12.55%
jan 1, 1979
2.086
-0.381
-15.44%
jan 1, 1980
2.387
+0.301
14.43%
jan 1, 1981
3.367
+0.98
41.07%
jan 1, 1982
2.197
-1.17
-34.76%
jan 1, 1983
2.07
-0.127
-5.78%
jan 1, 1984
2.251
+0.181
8.73%
jan 1, 1985
2.722
+0.471
20.93%
jan 1, 1986
2.69
-0.032
-1.19%
jan 1, 1987
2.226
-0.464
-17.26%
jan 1, 1988
1.179
-1.047
-47.04%
jan 1, 1989
1.317
+0.138
11.69%
jan 1, 1990
1.149
-0.167
-12.72%
jan 1, 1991
1.68
+0.531
46.18%
jan 1, 1992
1.131
-0.549
-32.69%
jan 1, 1993
6.222
+5.092
450.39%
jan 1, 1994
6.424
+0.202
3.24%
jan 1, 1995
6.179
-0.245
-3.82%
jan 1, 1996
5.276
-0.903
-14.61%
jan 1, 1997
5.681
+0.405
7.68%
jan 1, 1998
3.814
-1.867
-32.86%
jan 1, 1999
4.152
+0.337
8.84%
jan 1, 2000
5.757
+1.605
38.66%
jan 1, 2001
5.951
+0.195
3.38%
jan 1, 2002
6.075
+0.123
2.07%
jan 1, 2003
6.944
+0.869
14.31%
jan 1, 2004
7.943
+0.999
14.39%
jan 1, 2005
6.54
-1.403
-17.67%
jan 1, 2006
4.892
-1.648
-25.2%
jan 1, 2007
4.869
-0.023
-0.47%
jan 1, 2008
3.371
-1.497
-30.76%
jan 1, 2009
2.716
-0.656
-19.45%
jan 1, 2010
4.612
+1.897
69.84%
jan 1, 2011
3.668
-0.944
-20.47%
jan 1, 2012
5.135
+1.467
40.01%
jan 1, 2013
3.068
-2.067
-40.26%
jan 1, 2014
3.03
-0.038
-1.25%
jan 1, 2015
2.765
-0.265
-8.74%
jan 1, 2016
2.687
-0.078
-2.84%
Ranking of countries by current statistics by years


Comments: