29
/
en
AIzaSyAYiBZKx7MnpbEhh9jyipgxe19OcubqV5w
April 1, 2024
253181
Sudan
SDN
true
2
1
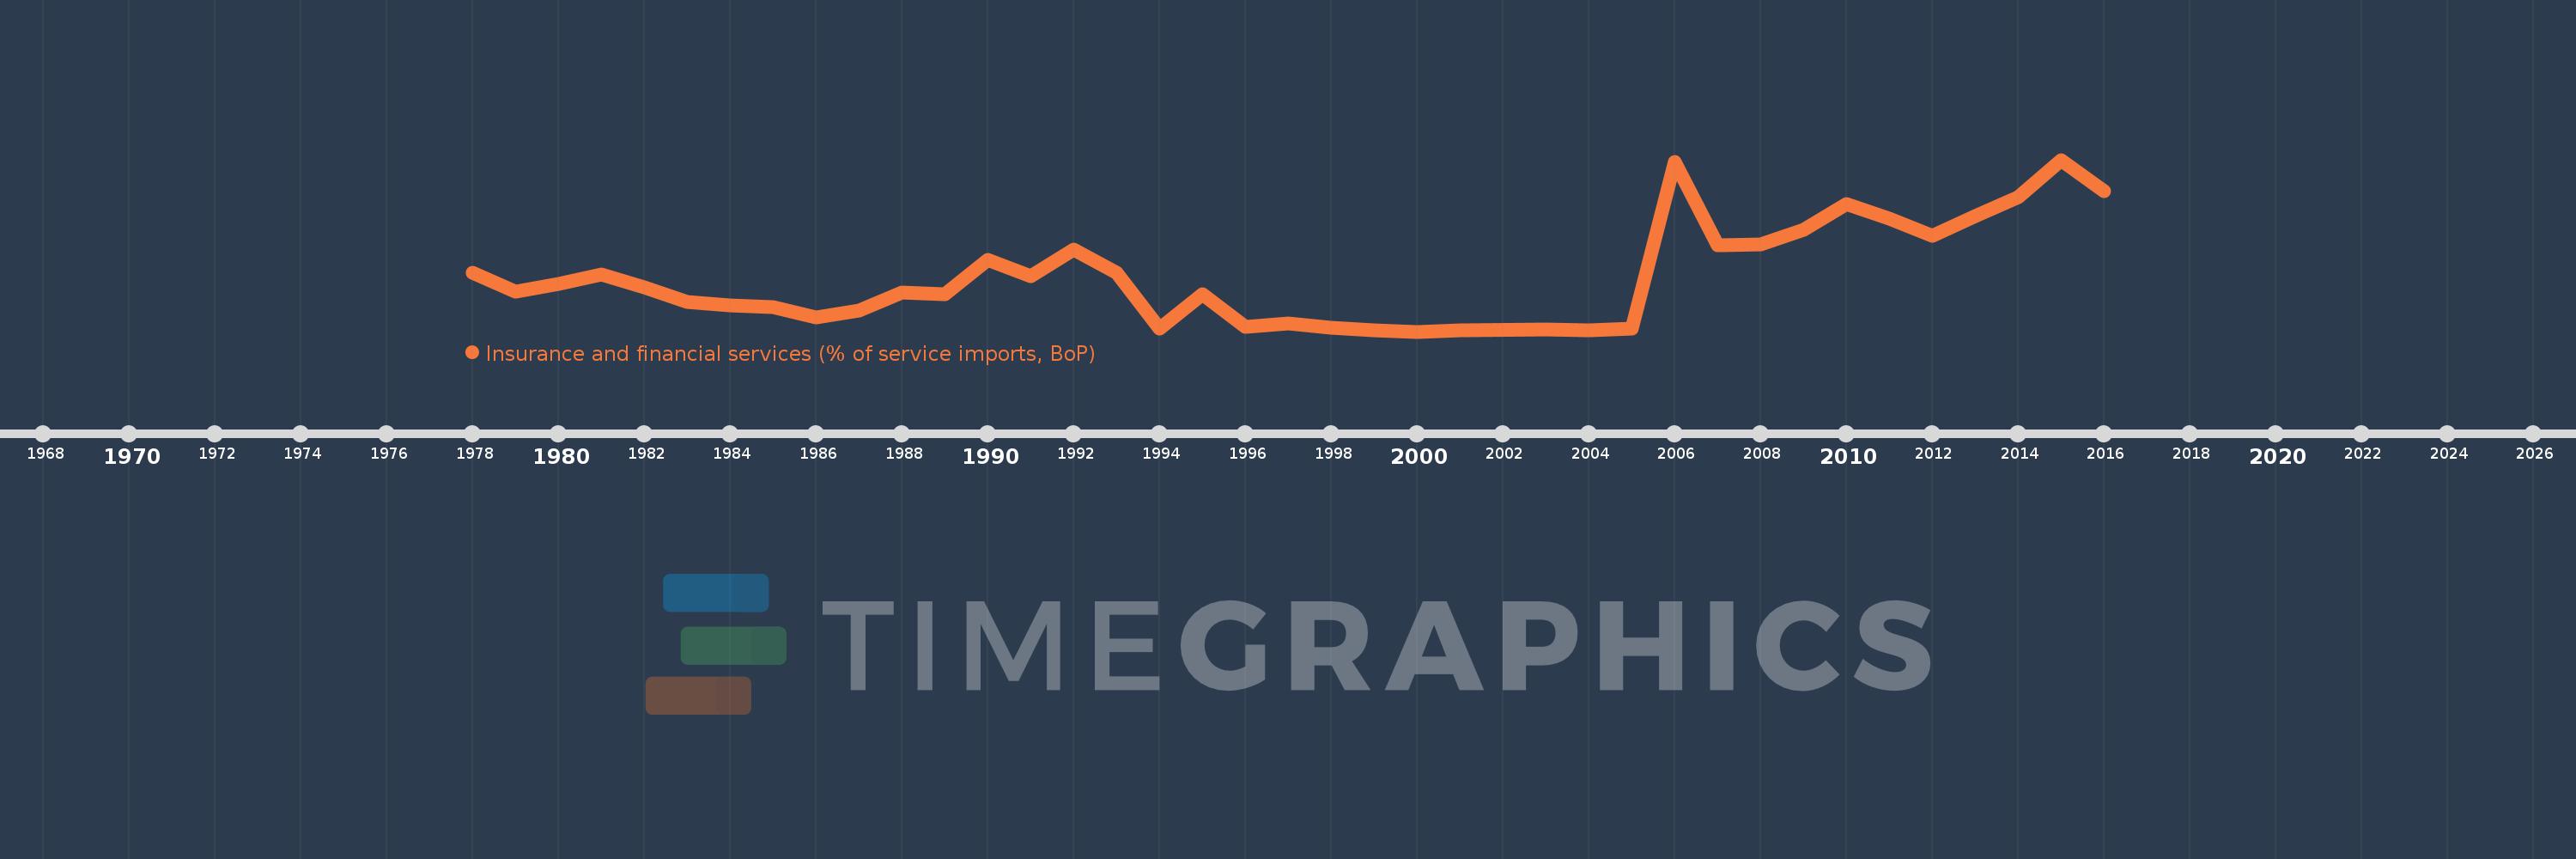
Insurance and financial services (% of service imports, BoP)
2016,2015,2014,2013,2012,2011,2010,2009,2008,2007,2006,2005,2004,2003,2001,2000,1999,1998,1997,1996,1995,1994,1993,1992,1991,1990,1989,1988,1987,1986,1985,1984,1983,1982,1981,1980,1979,1978
This statistics in other country:
AfghanistanAlbaniaAlgeriaAngolaAntigua and BarbudaArab WorldArgentinaArmeniaArubaAustraliaAustriaAzerbaijanBahamas, TheBahrainBangladeshBarbadosBelarusBelgiumBelizeBeninBermudaBhutanBoliviaBosnia and HerzegovinaBotswanaBrazilBrunei DarussalamBulgariaBurkina FasoBurundiCabo VerdeCambodiaCameroonCanadaCaribbean small statesCentral African RepublicCentral Europe and the BalticsChadChileChinaColombiaComorosCongo, Dem. Rep.Congo, Rep.Costa RicaCote d'IvoireCroatiaCuracaoCyprusCzech RepublicDenmarkDjiboutiDominicaDominican RepublicEarly-demographic dividendEast Asia & PacificEast Asia & Pacific (excluding high income)East Asia & Pacific (IDA & IBRD countries)EcuadorEgypt, Arab Rep.El SalvadorEquatorial GuineaEritreaEstoniaEthiopiaEuro areaEurope & Central AsiaEurope & Central Asia (excluding high income)Europe & Central Asia (IDA & IBRD countries)European UnionFaroe IslandsFijiFinlandFragile and conflict affected situationsFranceFrench PolynesiaGabonGambia, TheGeorgiaGermanyGhanaGreeceGrenadaGuatemalaGuineaGuinea-BissauGuyanaHaitiHeavily indebted poor countries (HIPC)High incomeHondurasHong Kong SAR, ChinaHungaryIBRD onlyIcelandIDA & IBRD totalIDA onlyIDA totalIndiaIndonesiaIran, Islamic Rep.IraqIrelandIsraelItalyJamaicaJapanJordanKazakhstanKenyaKiribatiKorea, Rep.KosovoKuwaitKyrgyz RepublicLao PDRLate-demographic dividendLatin America & Caribbean Latin America & Caribbean (excluding high income)Latin America & the Caribbean (IDA & IBRD countries)LatviaLeast developed countries: UN classificationLebanonLesothoLiberiaLibyaLithuaniaLow & middle incomeLow incomeLower middle incomeLuxembourgMacao SAR, ChinaMacedonia, FYRMadagascarMalawiMalaysiaMaldivesMaliMaltaMarshall IslandsMauritaniaMauritiusMexicoMicronesia, Fed. Sts.Middle East & North AfricaMiddle East & North Africa (excluding high income)Middle East & North Africa (IDA & IBRD countries)Middle incomeMoldovaMongoliaMontenegroMoroccoMozambiqueMyanmarNamibiaNepalNetherlandsNew CaledoniaNew ZealandNicaraguaNigerNigeriaNorth AmericaNorwayOECD membersOmanOther small statesPacific island small statesPakistanPalauPanamaPapua New GuineaParaguayPeruPhilippinesPolandPortugalPost-demographic dividendPre-demographic dividendQatarRomaniaRussian FederationRwandaSamoaSao Tome and PrincipeSaudi ArabiaSenegalSerbiaSeychellesSierra LeoneSingaporeSint Maarten (Dutch part)Slovak RepublicSloveniaSmall statesSolomon IslandsSouth AfricaSouth AsiaSouth Asia (IDA & IBRD)South SudanSpainSri LankaSt. Kitts and NevisSt. LuciaSt. Vincent and the GrenadinesSub-Saharan Africa Sub-Saharan Africa (excluding high income)Sub-Saharan Africa (IDA & IBRD countries)SudanSurinameSwazilandSwedenSwitzerlandSyrian Arab RepublicTajikistanTanzaniaThailandTimor-LesteTogoTongaTrinidad and TobagoTunisiaTurkeyTuvaluUgandaUkraineUnited KingdomUnited StatesUpper middle incomeUruguayVanuatuVenezuela, RBWest Bank and GazaWorldYemen, Rep.ZambiaZimbabwe Timeline:
This timeline shows a graph from 1978 to 2016 of Sudan. No data until 1977. Number of actual observations by date: 38.
Source name:
World Development Indicators
Source organization:
International Monetary Fund, Balance of Payments Statistics Yearbook and data files.
Categories, topics:
Economy & Growth, Private Sector, Trade
Last updated:
apr 23, 2017
Indicators value changes by year
Minimum:
-0.073
jan 1, 2000
Maximum:
13.604
jan 1, 2015
At the date of observation
Value
Absolute change
Change from previous value
jan 1, 1978
4.625
+4.625
0.0%
jan 1, 1979
3.119
-1.506
-32.56%
jan 1, 1980
3.692
+0.572
18.34%
jan 1, 1981
4.459
+0.767
20.78%
jan 1, 1982
3.465
-0.994
-22.29%
jan 1, 1983
2.263
-1.202
-34.7%
jan 1, 1984
2.026
-0.237
-10.48%
jan 1, 1985
1.897
-0.128
-6.33%
jan 1, 1986
1.088
-0.81
-42.68%
jan 1, 1987
1.585
+0.497
45.72%
jan 1, 1988
3.006
+1.421
89.68%
jan 1, 1989
2.897
-0.109
-3.63%
jan 1, 1990
5.615
+2.718
93.81%
jan 1, 1991
4.346
-1.268
-22.59%
jan 1, 1992
6.467
+2.121
48.79%
jan 1, 1993
4.606
-1.862
-28.79%
jan 1, 1994
0.182
-4.423
-96.05%
jan 1, 1995
2.906
+2.724
1.5K%
jan 1, 1996
0.29
-2.615
-90.01%
jan 1, 1997
0.548
+0.258
88.8%
jan 1, 1998
0.231
-0.316
-57.75%
jan 1, 1999
0.049
-0.182
-78.82%
jan 1, 2000
-0.073
-0.122
-248.42%
jan 1, 2001
0.031
+0.104
-142.45%
jan 1, 2003
0.078
+0.047
153.28%
jan 1, 2004
0.019
-0.059
-75.36%
jan 1, 2005
0.155
+0.136
704.33%
jan 1, 2006
13.455
+13.3
8.58K%
jan 1, 2007
6.775
-6.68
-49.64%
jan 1, 2008
6.837
+0.061
0.91%
jan 1, 2009
8.011
+1.174
17.18%
jan 1, 2010
10.107
+2.096
26.16%
jan 1, 2011
8.92
-1.187
-11.74%
jan 1, 2012
7.582
-1.338
-15.0%
jan 1, 2013
9.142
+1.559
20.57%
jan 1, 2014
10.633
+1.491
16.31%
jan 1, 2015
13.604
+2.971
27.94%
jan 1, 2016
11.105
-2.499
-18.37%
Ranking of countries by current statistics by years


Comments: