29
/
en
AIzaSyAYiBZKx7MnpbEhh9jyipgxe19OcubqV5w
April 1, 2024
89965
Botswana
BWA
true
2
1
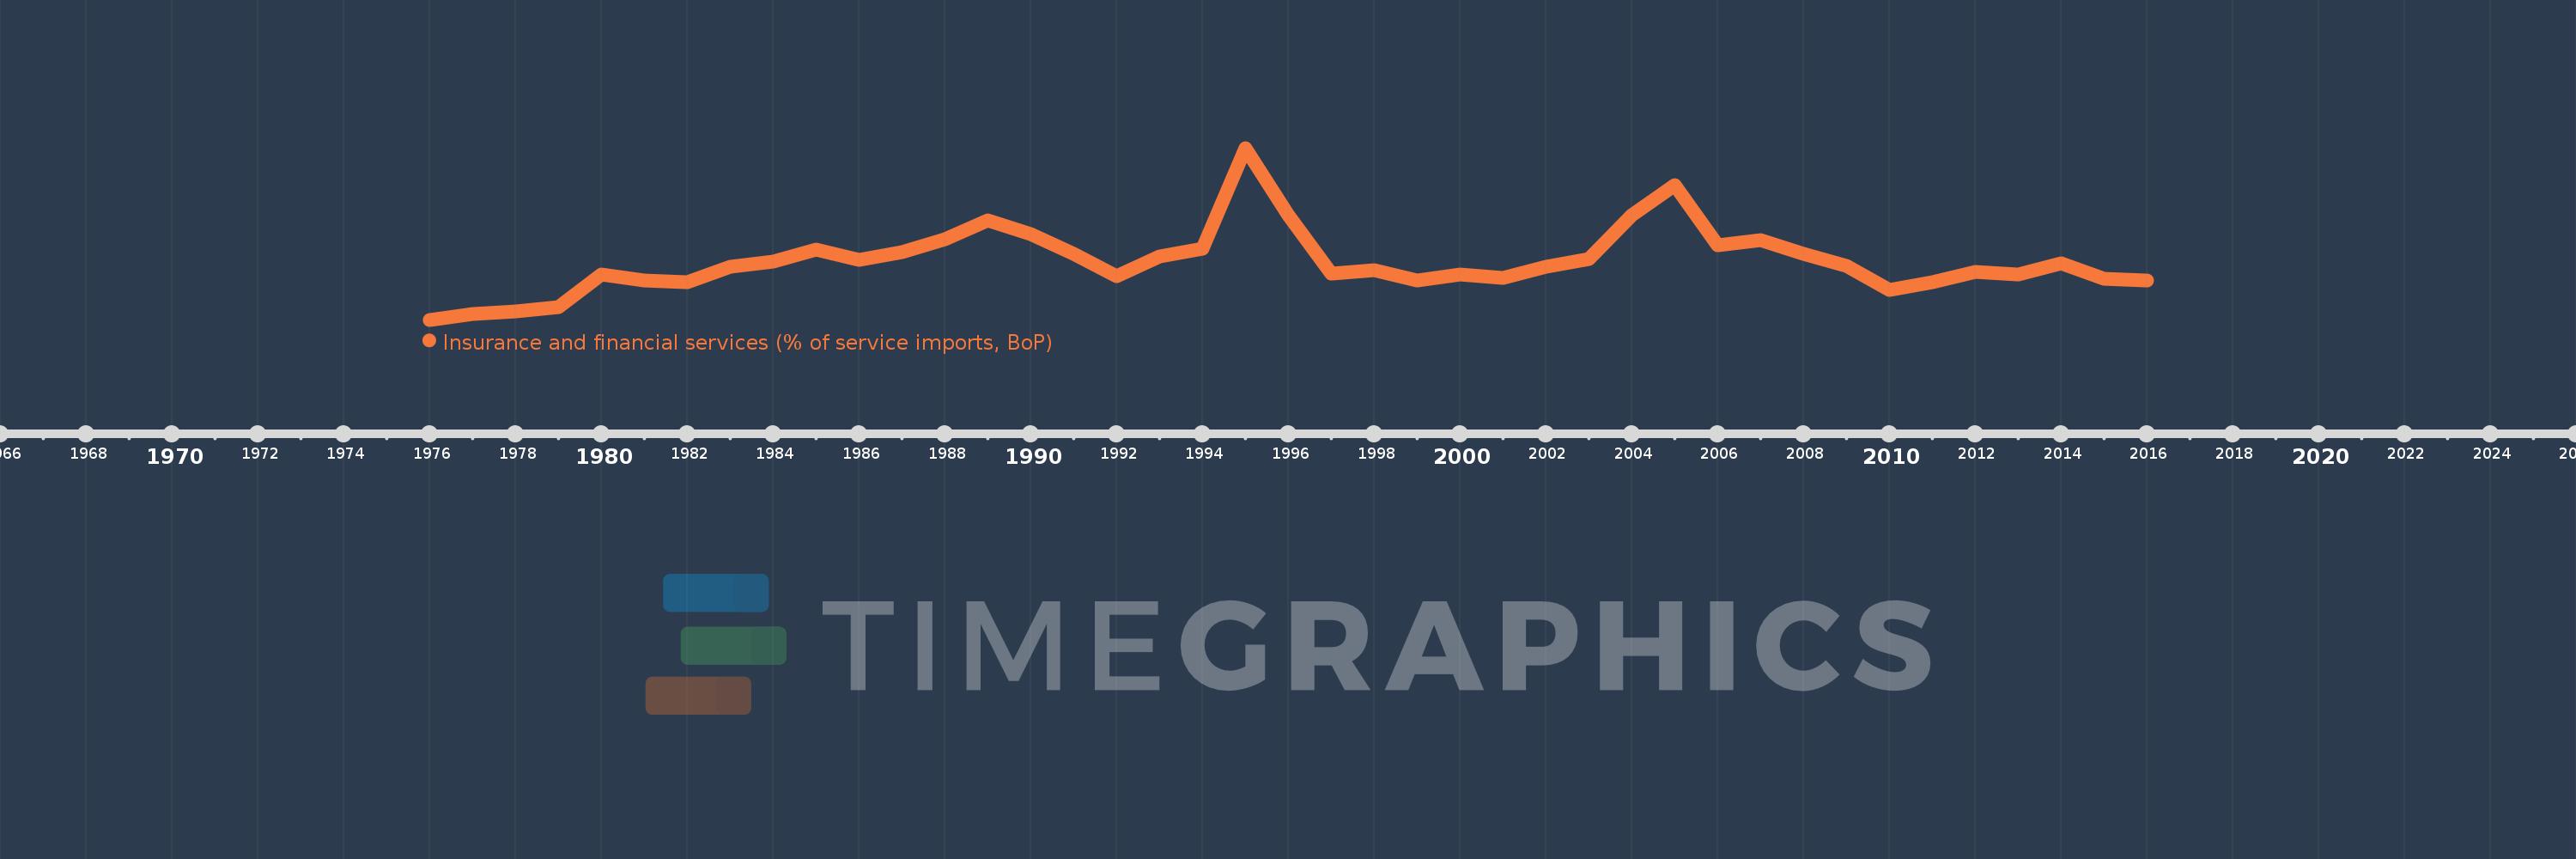
Insurance and financial services (% of service imports, BoP)
2016,2015,2014,2013,2012,2011,2010,2009,2008,2007,2006,2005,2004,2003,2002,2001,2000,1999,1998,1997,1996,1995,1994,1993,1992,1991,1990,1989,1988,1987,1986,1985,1984,1983,1982,1981,1980,1979,1978,1977,1976
This statistics in other country:
AfghanistanAlbaniaAlgeriaAngolaAntigua and BarbudaArab WorldArgentinaArmeniaArubaAustraliaAustriaAzerbaijanBahamas, TheBahrainBangladeshBarbadosBelarusBelgiumBelizeBeninBermudaBhutanBoliviaBosnia and HerzegovinaBotswanaBrazilBrunei DarussalamBulgariaBurkina FasoBurundiCabo VerdeCambodiaCameroonCanadaCaribbean small statesCentral African RepublicCentral Europe and the BalticsChadChileChinaColombiaComorosCongo, Dem. Rep.Congo, Rep.Costa RicaCote d'IvoireCroatiaCuracaoCyprusCzech RepublicDenmarkDjiboutiDominicaDominican RepublicEarly-demographic dividendEast Asia & PacificEast Asia & Pacific (excluding high income)East Asia & Pacific (IDA & IBRD countries)EcuadorEgypt, Arab Rep.El SalvadorEquatorial GuineaEritreaEstoniaEthiopiaEuro areaEurope & Central AsiaEurope & Central Asia (excluding high income)Europe & Central Asia (IDA & IBRD countries)European UnionFaroe IslandsFijiFinlandFragile and conflict affected situationsFranceFrench PolynesiaGabonGambia, TheGeorgiaGermanyGhanaGreeceGrenadaGuatemalaGuineaGuinea-BissauGuyanaHaitiHeavily indebted poor countries (HIPC)High incomeHondurasHong Kong SAR, ChinaHungaryIBRD onlyIcelandIDA & IBRD totalIDA onlyIDA totalIndiaIndonesiaIran, Islamic Rep.IraqIrelandIsraelItalyJamaicaJapanJordanKazakhstanKenyaKiribatiKorea, Rep.KosovoKuwaitKyrgyz RepublicLao PDRLate-demographic dividendLatin America & Caribbean Latin America & Caribbean (excluding high income)Latin America & the Caribbean (IDA & IBRD countries)LatviaLeast developed countries: UN classificationLebanonLesothoLiberiaLibyaLithuaniaLow & middle incomeLow incomeLower middle incomeLuxembourgMacao SAR, ChinaMacedonia, FYRMadagascarMalawiMalaysiaMaldivesMaliMaltaMarshall IslandsMauritaniaMauritiusMexicoMicronesia, Fed. Sts.Middle East & North AfricaMiddle East & North Africa (excluding high income)Middle East & North Africa (IDA & IBRD countries)Middle incomeMoldovaMongoliaMontenegroMoroccoMozambiqueMyanmarNamibiaNepalNetherlandsNew CaledoniaNew ZealandNicaraguaNigerNigeriaNorth AmericaNorwayOECD membersOmanOther small statesPacific island small statesPakistanPalauPanamaPapua New GuineaParaguayPeruPhilippinesPolandPortugalPost-demographic dividendPre-demographic dividendQatarRomaniaRussian FederationRwandaSamoaSao Tome and PrincipeSaudi ArabiaSenegalSerbiaSeychellesSierra LeoneSingaporeSint Maarten (Dutch part)Slovak RepublicSloveniaSmall statesSolomon IslandsSouth AfricaSouth AsiaSouth Asia (IDA & IBRD)South SudanSpainSri LankaSt. Kitts and NevisSt. LuciaSt. Vincent and the GrenadinesSub-Saharan Africa Sub-Saharan Africa (excluding high income)Sub-Saharan Africa (IDA & IBRD countries)SudanSurinameSwazilandSwedenSwitzerlandSyrian Arab RepublicTajikistanTanzaniaThailandTimor-LesteTogoTongaTrinidad and TobagoTunisiaTurkeyTuvaluUgandaUkraineUnited KingdomUnited StatesUpper middle incomeUruguayVanuatuVenezuela, RBWest Bank and GazaWorldYemen, Rep.ZambiaZimbabwe Timeline:
This timeline shows a graph from 1976 to 2016 of Botswana. No data until 1975. Number of actual observations by date: 41.
Source name:
World Development Indicators
Source organization:
International Monetary Fund, Balance of Payments Statistics Yearbook and data files.
Categories, topics:
Economy & Growth, Private Sector, Trade
Last updated:
apr 23, 2017
Indicators value changes by year
At the date of observation
Value
Absolute change
Change from previous value
jan 1, 1976
1.085
+1.085
0.0%
jan 1, 1977
1.481
+0.396
36.44%
jan 1, 1978
1.651
+0.17
11.5%
jan 1, 1979
1.896
+0.244
14.81%
jan 1, 1980
4.066
+2.171
114.51%
jan 1, 1981
3.677
-0.389
-9.58%
jan 1, 1982
3.578
-0.099
-2.7%
jan 1, 1983
4.588
+1.01
28.24%
jan 1, 1984
4.928
+0.34
7.41%
jan 1, 1985
5.717
+0.788
16.0%
jan 1, 1986
5.048
-0.668
-11.69%
jan 1, 1987
5.57
+0.522
10.33%
jan 1, 1988
6.398
+0.828
14.87%
jan 1, 1989
7.643
+1.245
19.46%
jan 1, 1990
6.752
-0.892
-11.66%
jan 1, 1991
5.433
-1.318
-19.53%
jan 1, 1992
3.957
-1.476
-27.17%
jan 1, 1993
5.252
+1.295
32.73%
jan 1, 1994
5.767
+0.515
9.8%
jan 1, 1995
12.43
+6.663
115.54%
jan 1, 1996
7.99
-4.44
-35.72%
jan 1, 1997
4.148
-3.842
-48.09%
jan 1, 1998
4.372
+0.224
5.4%
jan 1, 1999
3.673
-0.699
-15.99%
jan 1, 2000
4.082
+0.41
11.16%
jan 1, 2001
3.849
-0.233
-5.71%
jan 1, 2002
4.594
+0.744
19.33%
jan 1, 2003
5.117
+0.523
11.39%
jan 1, 2004
7.998
+2.881
56.31%
jan 1, 2005
9.951
+1.953
24.42%
jan 1, 2006
5.987
-3.964
-39.83%
jan 1, 2007
6.341
+0.353
5.9%
jan 1, 2008
5.409
-0.932
-14.7%
jan 1, 2009
4.619
-0.79
-14.6%
jan 1, 2010
3.048
-1.571
-34.01%
jan 1, 2011
3.546
+0.498
16.33%
jan 1, 2012
4.244
+0.697
19.67%
jan 1, 2013
4.052
-0.192
-4.51%
jan 1, 2014
4.82
+0.768
18.95%
jan 1, 2015
3.817
-1.003
-20.8%
jan 1, 2016
3.671
-0.146
-3.84%
Ranking of countries by current statistics by years


Comments: