29
/
en
AIzaSyAYiBZKx7MnpbEhh9jyipgxe19OcubqV5w
April 1, 2024
213118
Nigeria
NGA
true
2
1
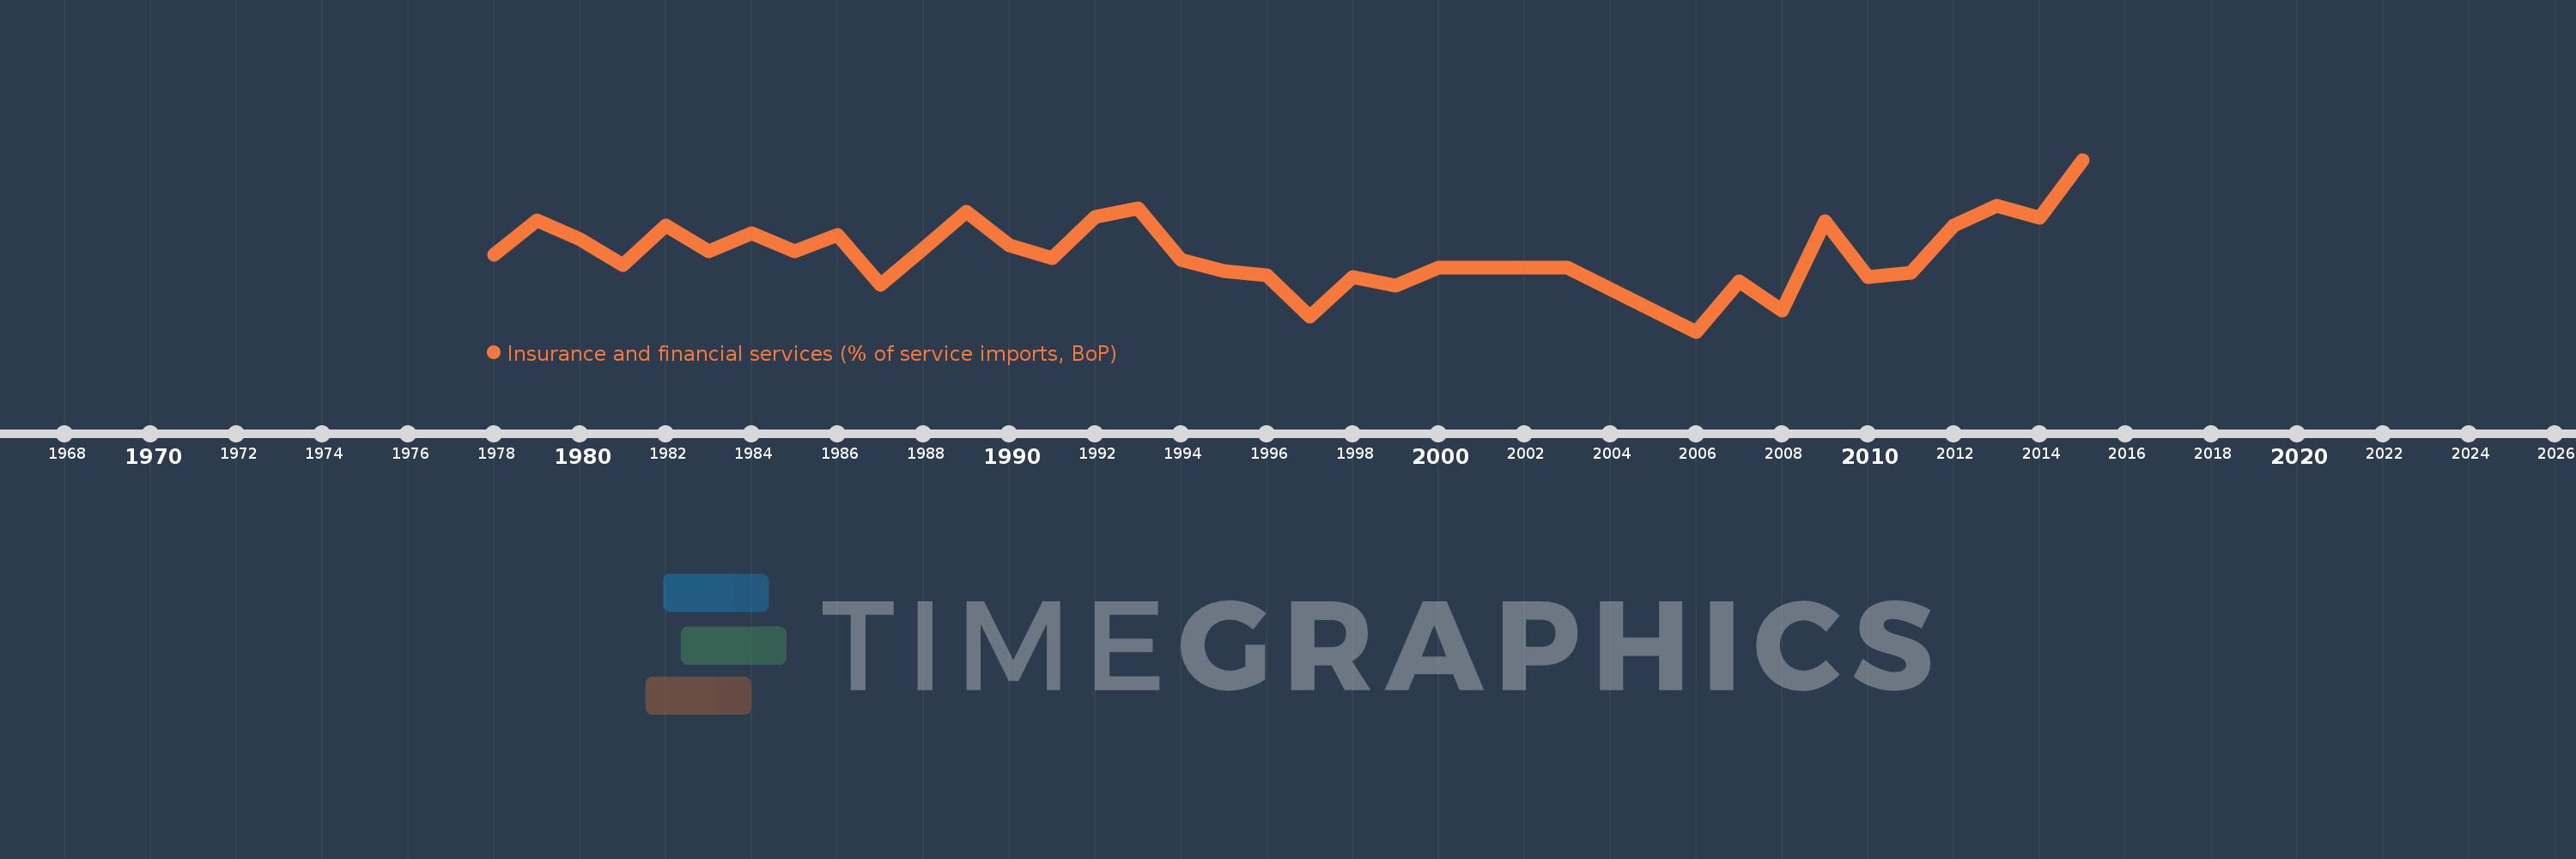
Insurance and financial services (% of service imports, BoP)
2015,2014,2013,2012,2011,2010,2009,2008,2007,2006,2003,2002,2001,2000,1999,1998,1997,1996,1995,1994,1993,1992,1991,1990,1989,1988,1987,1986,1985,1984,1983,1982,1981,1980,1979,1978
This statistics in other country:
AfghanistanAlbaniaAlgeriaAngolaAntigua and BarbudaArab WorldArgentinaArmeniaArubaAustraliaAustriaAzerbaijanBahamas, TheBahrainBangladeshBarbadosBelarusBelgiumBelizeBeninBermudaBhutanBoliviaBosnia and HerzegovinaBotswanaBrazilBrunei DarussalamBulgariaBurkina FasoBurundiCabo VerdeCambodiaCameroonCanadaCaribbean small statesCentral African RepublicCentral Europe and the BalticsChadChileChinaColombiaComorosCongo, Dem. Rep.Congo, Rep.Costa RicaCote d'IvoireCroatiaCuracaoCyprusCzech RepublicDenmarkDjiboutiDominicaDominican RepublicEarly-demographic dividendEast Asia & PacificEast Asia & Pacific (excluding high income)East Asia & Pacific (IDA & IBRD countries)EcuadorEgypt, Arab Rep.El SalvadorEquatorial GuineaEritreaEstoniaEthiopiaEuro areaEurope & Central AsiaEurope & Central Asia (excluding high income)Europe & Central Asia (IDA & IBRD countries)European UnionFaroe IslandsFijiFinlandFragile and conflict affected situationsFranceFrench PolynesiaGabonGambia, TheGeorgiaGermanyGhanaGreeceGrenadaGuatemalaGuineaGuinea-BissauGuyanaHaitiHeavily indebted poor countries (HIPC)High incomeHondurasHong Kong SAR, ChinaHungaryIBRD onlyIcelandIDA & IBRD totalIDA onlyIDA totalIndiaIndonesiaIran, Islamic Rep.IraqIrelandIsraelItalyJamaicaJapanJordanKazakhstanKenyaKiribatiKorea, Rep.KosovoKuwaitKyrgyz RepublicLao PDRLate-demographic dividendLatin America & Caribbean Latin America & Caribbean (excluding high income)Latin America & the Caribbean (IDA & IBRD countries)LatviaLeast developed countries: UN classificationLebanonLesothoLiberiaLibyaLithuaniaLow & middle incomeLow incomeLower middle incomeLuxembourgMacao SAR, ChinaMacedonia, FYRMadagascarMalawiMalaysiaMaldivesMaliMaltaMarshall IslandsMauritaniaMauritiusMexicoMicronesia, Fed. Sts.Middle East & North AfricaMiddle East & North Africa (excluding high income)Middle East & North Africa (IDA & IBRD countries)Middle incomeMoldovaMongoliaMontenegroMoroccoMozambiqueMyanmarNamibiaNepalNetherlandsNew CaledoniaNew ZealandNicaraguaNigerNigeriaNorth AmericaNorwayOECD membersOmanOther small statesPacific island small statesPakistanPalauPanamaPapua New GuineaParaguayPeruPhilippinesPolandPortugalPost-demographic dividendPre-demographic dividendQatarRomaniaRussian FederationRwandaSamoaSao Tome and PrincipeSaudi ArabiaSenegalSerbiaSeychellesSierra LeoneSingaporeSint Maarten (Dutch part)Slovak RepublicSloveniaSmall statesSolomon IslandsSouth AfricaSouth AsiaSouth Asia (IDA & IBRD)South SudanSpainSri LankaSt. Kitts and NevisSt. LuciaSt. Vincent and the GrenadinesSub-Saharan Africa Sub-Saharan Africa (excluding high income)Sub-Saharan Africa (IDA & IBRD countries)SudanSurinameSwazilandSwedenSwitzerlandSyrian Arab RepublicTajikistanTanzaniaThailandTimor-LesteTogoTongaTrinidad and TobagoTunisiaTurkeyTuvaluUgandaUkraineUnited KingdomUnited StatesUpper middle incomeUruguayVanuatuVenezuela, RBWest Bank and GazaWorldYemen, Rep.ZambiaZimbabwe Timeline:
This timeline shows a graph from 1978 to 2015 of Nigeria. No data until 1977. Number of actual observations by date: 36.
Source name:
World Development Indicators
Source organization:
International Monetary Fund, Balance of Payments Statistics Yearbook and data files.
Categories, topics:
Economy & Growth, Private Sector, Trade
Last updated:
apr 23, 2017
Indicators value changes by year
At the date of observation
Value
Absolute change
Change from previous value
jan 1, 1978
3.144
+3.144
0.0%
jan 1, 1979
4.345
+1.201
38.19%
jan 1, 1980
3.669
-0.676
-15.55%
jan 1, 1981
2.768
-0.901
-24.56%
jan 1, 1982
4.14
+1.372
49.55%
jan 1, 1983
3.249
-0.891
-21.53%
jan 1, 1984
3.891
+0.643
19.78%
jan 1, 1985
3.241
-0.65
-16.7%
jan 1, 1986
3.818
+0.576
17.77%
jan 1, 1987
2.092
-1.726
-45.21%
jan 1, 1988
3.356
+1.264
60.45%
jan 1, 1989
4.633
+1.276
38.03%
jan 1, 1990
3.457
-1.175
-25.37%
jan 1, 1991
3.006
-0.451
-13.05%
jan 1, 1992
4.451
+1.445
48.05%
jan 1, 1993
4.751
+0.301
6.75%
jan 1, 1994
2.951
-1.8
-37.89%
jan 1, 1995
2.557
-0.394
-13.35%
jan 1, 1996
2.427
-0.13
-5.1%
jan 1, 1997
0.971
-1.456
-59.98%
jan 1, 1998
2.34
+1.369
140.93%
jan 1, 1999
2.046
-0.294
-12.56%
jan 1, 2000
2.679
+0.633
30.93%
jan 1, 2001
2.68
+0.001
0.06%
jan 1, 2006
0.449
-2.231
-83.24%
jan 1, 2007
2.193
+1.744
388.33%
jan 1, 2008
1.191
-1.003
-45.71%
jan 1, 2009
4.29
+3.099
260.28%
jan 1, 2010
2.359
-1.931
-45.0%
jan 1, 2011
2.509
+0.15
6.34%
jan 1, 2012
4.156
+1.647
65.64%
jan 1, 2013
4.837
+0.681
16.39%
jan 1, 2014
4.418
-0.419
-8.67%
jan 1, 2015
6.445
+2.028
45.89%
Ranking of countries by current statistics by years


Comments: