29
/
en
AIzaSyAYiBZKx7MnpbEhh9jyipgxe19OcubqV5w
April 1, 2024
174267
Lao PDR
LAO
true
2
1
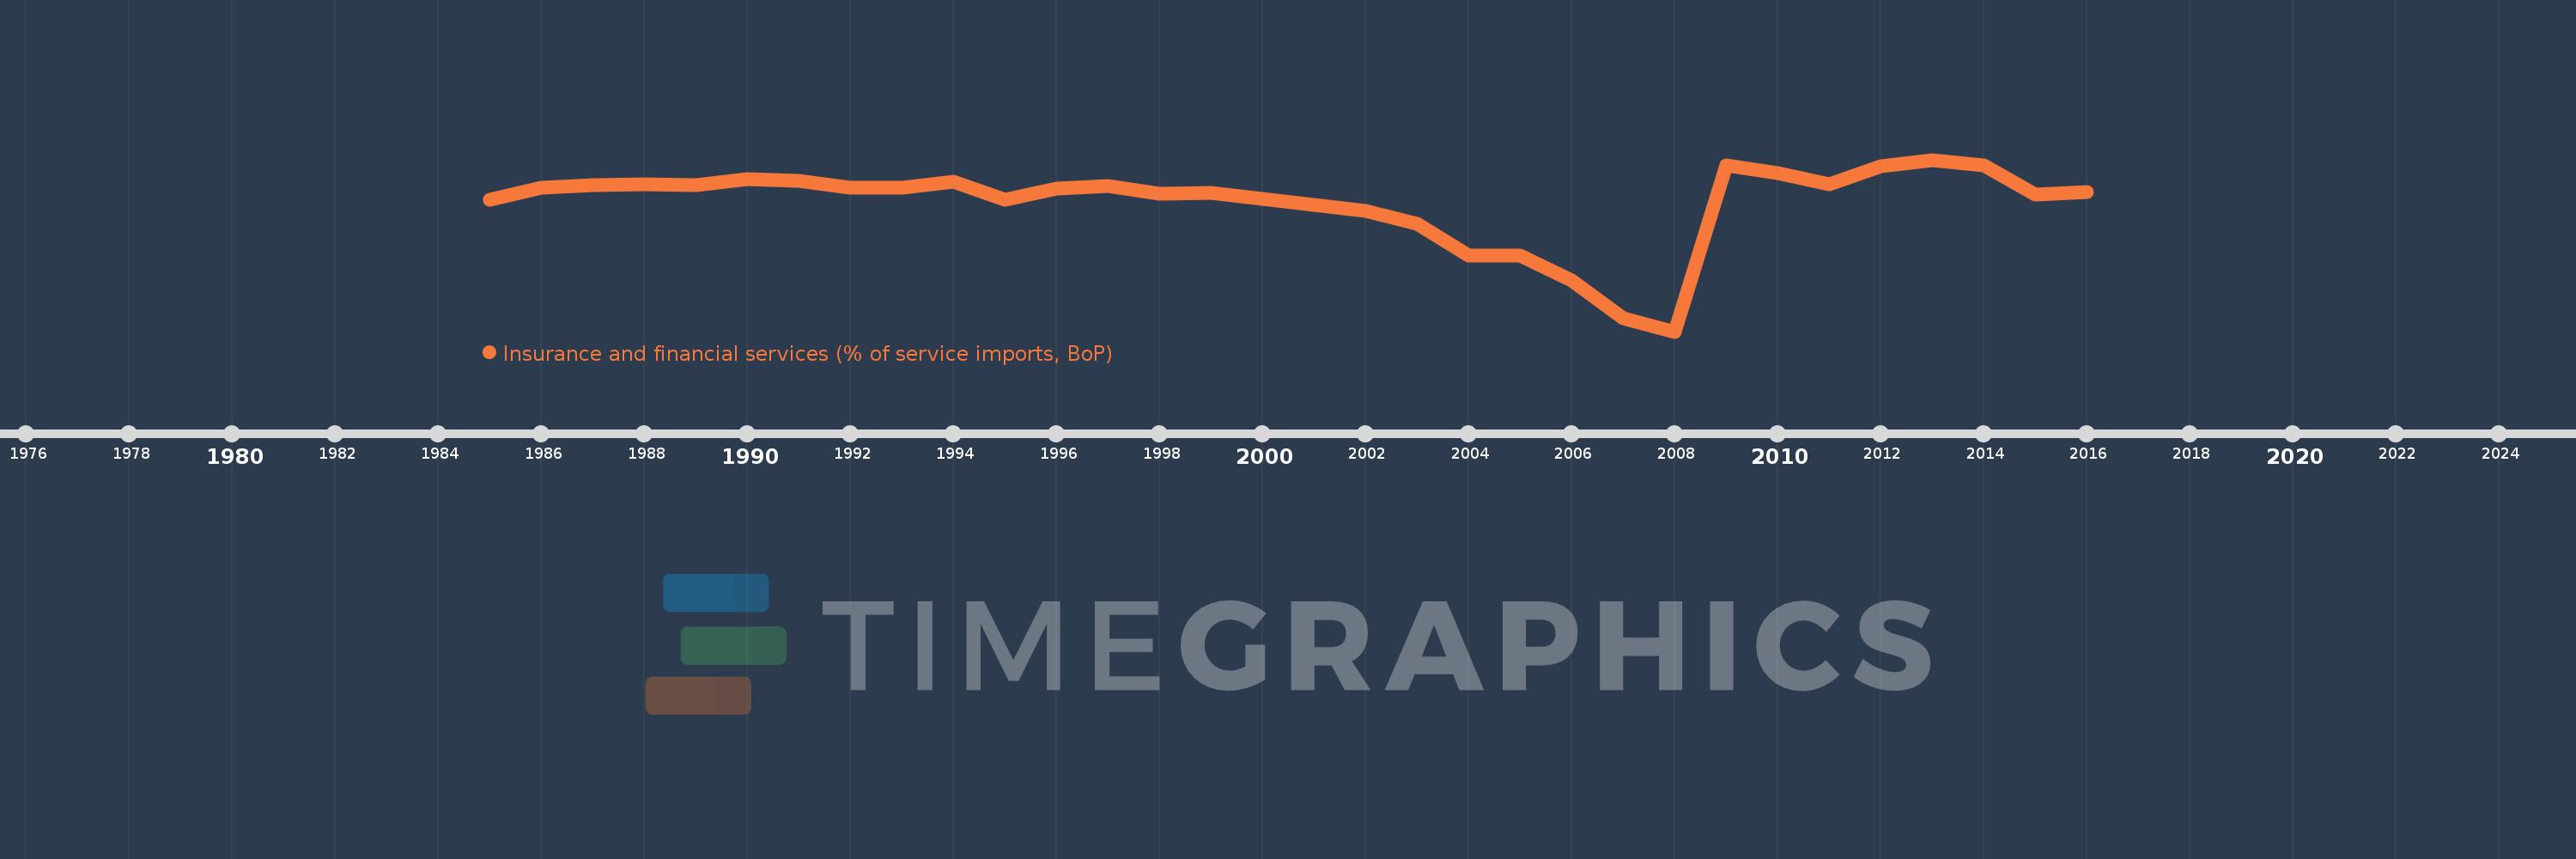
Insurance and financial services (% of service imports, BoP)
2016,2015,2014,2013,2012,2011,2010,2009,2008,2007,2006,2005,2004,2003,2002,1999,1998,1997,1996,1995,1994,1993,1992,1991,1990,1989,1988,1987,1986,1985
This statistics in other country:
AfghanistanAlbaniaAlgeriaAngolaAntigua and BarbudaArab WorldArgentinaArmeniaArubaAustraliaAustriaAzerbaijanBahamas, TheBahrainBangladeshBarbadosBelarusBelgiumBelizeBeninBermudaBhutanBoliviaBosnia and HerzegovinaBotswanaBrazilBrunei DarussalamBulgariaBurkina FasoBurundiCabo VerdeCambodiaCameroonCanadaCaribbean small statesCentral African RepublicCentral Europe and the BalticsChadChileChinaColombiaComorosCongo, Dem. Rep.Congo, Rep.Costa RicaCote d'IvoireCroatiaCuracaoCyprusCzech RepublicDenmarkDjiboutiDominicaDominican RepublicEarly-demographic dividendEast Asia & PacificEast Asia & Pacific (excluding high income)East Asia & Pacific (IDA & IBRD countries)EcuadorEgypt, Arab Rep.El SalvadorEquatorial GuineaEritreaEstoniaEthiopiaEuro areaEurope & Central AsiaEurope & Central Asia (excluding high income)Europe & Central Asia (IDA & IBRD countries)European UnionFaroe IslandsFijiFinlandFragile and conflict affected situationsFranceFrench PolynesiaGabonGambia, TheGeorgiaGermanyGhanaGreeceGrenadaGuatemalaGuineaGuinea-BissauGuyanaHaitiHeavily indebted poor countries (HIPC)High incomeHondurasHong Kong SAR, ChinaHungaryIBRD onlyIcelandIDA & IBRD totalIDA onlyIDA totalIndiaIndonesiaIran, Islamic Rep.IraqIrelandIsraelItalyJamaicaJapanJordanKazakhstanKenyaKiribatiKorea, Rep.KosovoKuwaitKyrgyz RepublicLao PDRLate-demographic dividendLatin America & Caribbean Latin America & Caribbean (excluding high income)Latin America & the Caribbean (IDA & IBRD countries)LatviaLeast developed countries: UN classificationLebanonLesothoLiberiaLibyaLithuaniaLow & middle incomeLow incomeLower middle incomeLuxembourgMacao SAR, ChinaMacedonia, FYRMadagascarMalawiMalaysiaMaldivesMaliMaltaMarshall IslandsMauritaniaMauritiusMexicoMicronesia, Fed. Sts.Middle East & North AfricaMiddle East & North Africa (excluding high income)Middle East & North Africa (IDA & IBRD countries)Middle incomeMoldovaMongoliaMontenegroMoroccoMozambiqueMyanmarNamibiaNepalNetherlandsNew CaledoniaNew ZealandNicaraguaNigerNigeriaNorth AmericaNorwayOECD membersOmanOther small statesPacific island small statesPakistanPalauPanamaPapua New GuineaParaguayPeruPhilippinesPolandPortugalPost-demographic dividendPre-demographic dividendQatarRomaniaRussian FederationRwandaSamoaSao Tome and PrincipeSaudi ArabiaSenegalSerbiaSeychellesSierra LeoneSingaporeSint Maarten (Dutch part)Slovak RepublicSloveniaSmall statesSolomon IslandsSouth AfricaSouth AsiaSouth Asia (IDA & IBRD)South SudanSpainSri LankaSt. Kitts and NevisSt. LuciaSt. Vincent and the GrenadinesSub-Saharan Africa Sub-Saharan Africa (excluding high income)Sub-Saharan Africa (IDA & IBRD countries)SudanSurinameSwazilandSwedenSwitzerlandSyrian Arab RepublicTajikistanTanzaniaThailandTimor-LesteTogoTongaTrinidad and TobagoTunisiaTurkeyTuvaluUgandaUkraineUnited KingdomUnited StatesUpper middle incomeUruguayVanuatuVenezuela, RBWest Bank and GazaWorldYemen, Rep.ZambiaZimbabwe Timeline:
This timeline shows a graph from 1985 to 2016 of Lao PDR. No data until 1984. Number of actual observations by date: 30.
Source name:
World Development Indicators
Source organization:
International Monetary Fund, Balance of Payments Statistics Yearbook and data files.
Categories, topics:
Economy & Growth, Private Sector, Trade
Last updated:
apr 23, 2017
Indicators value changes by year
Minimum:
-36.777
jan 1, 2008
Maximum:
11.952
jan 1, 2013
At the date of observation
Value
Absolute change
Change from previous value
jan 1, 1985
0.522
+0.522
0.0%
jan 1, 1986
3.963
+3.441
659.52%
jan 1, 1987
4.734
+0.771
19.46%
jan 1, 1988
4.987
+0.253
5.35%
jan 1, 1989
4.869
-0.118
-2.37%
jan 1, 1990
6.589
+1.72
35.33%
jan 1, 1991
6.061
-0.529
-8.02%
jan 1, 1992
3.992
-2.069
-34.14%
jan 1, 1993
3.927
-0.065
-1.62%
jan 1, 1994
5.665
+1.738
44.26%
jan 1, 1995
0.657
-5.008
-88.4%
jan 1, 1996
3.865
+3.208
487.89%
jan 1, 1997
4.603
+0.738
19.09%
jan 1, 1998
2.391
-2.212
-48.05%
jan 1, 1999
2.51
+0.119
4.96%
jan 1, 2002
-2.553
-5.063
-201.72%
jan 1, 2003
-6.196
-3.643
142.71%
jan 1, 2004
-15.179
-8.982
144.96%
jan 1, 2005
-15.332
-0.154
1.01%
jan 1, 2006
-22.282
-6.95
45.33%
jan 1, 2007
-33.039
-10.757
48.28%
jan 1, 2008
-36.777
-3.738
11.32%
jan 1, 2009
10.476
+47.253
-128.49%
jan 1, 2010
8.092
-2.384
-22.76%
jan 1, 2011
5.012
-3.08
-38.06%
jan 1, 2012
10.128
+5.116
102.08%
jan 1, 2013
11.952
+1.825
18.02%
jan 1, 2014
10.271
-1.681
-14.07%
jan 1, 2015
2.16
-8.111
-78.97%
jan 1, 2016
2.702
+0.542
25.11%
Ranking of countries by current statistics by years


Comments: