29
/
en
AIzaSyAYiBZKx7MnpbEhh9jyipgxe19OcubqV5w
April 1, 2024
240585
Singapore
SGP
true
2
1
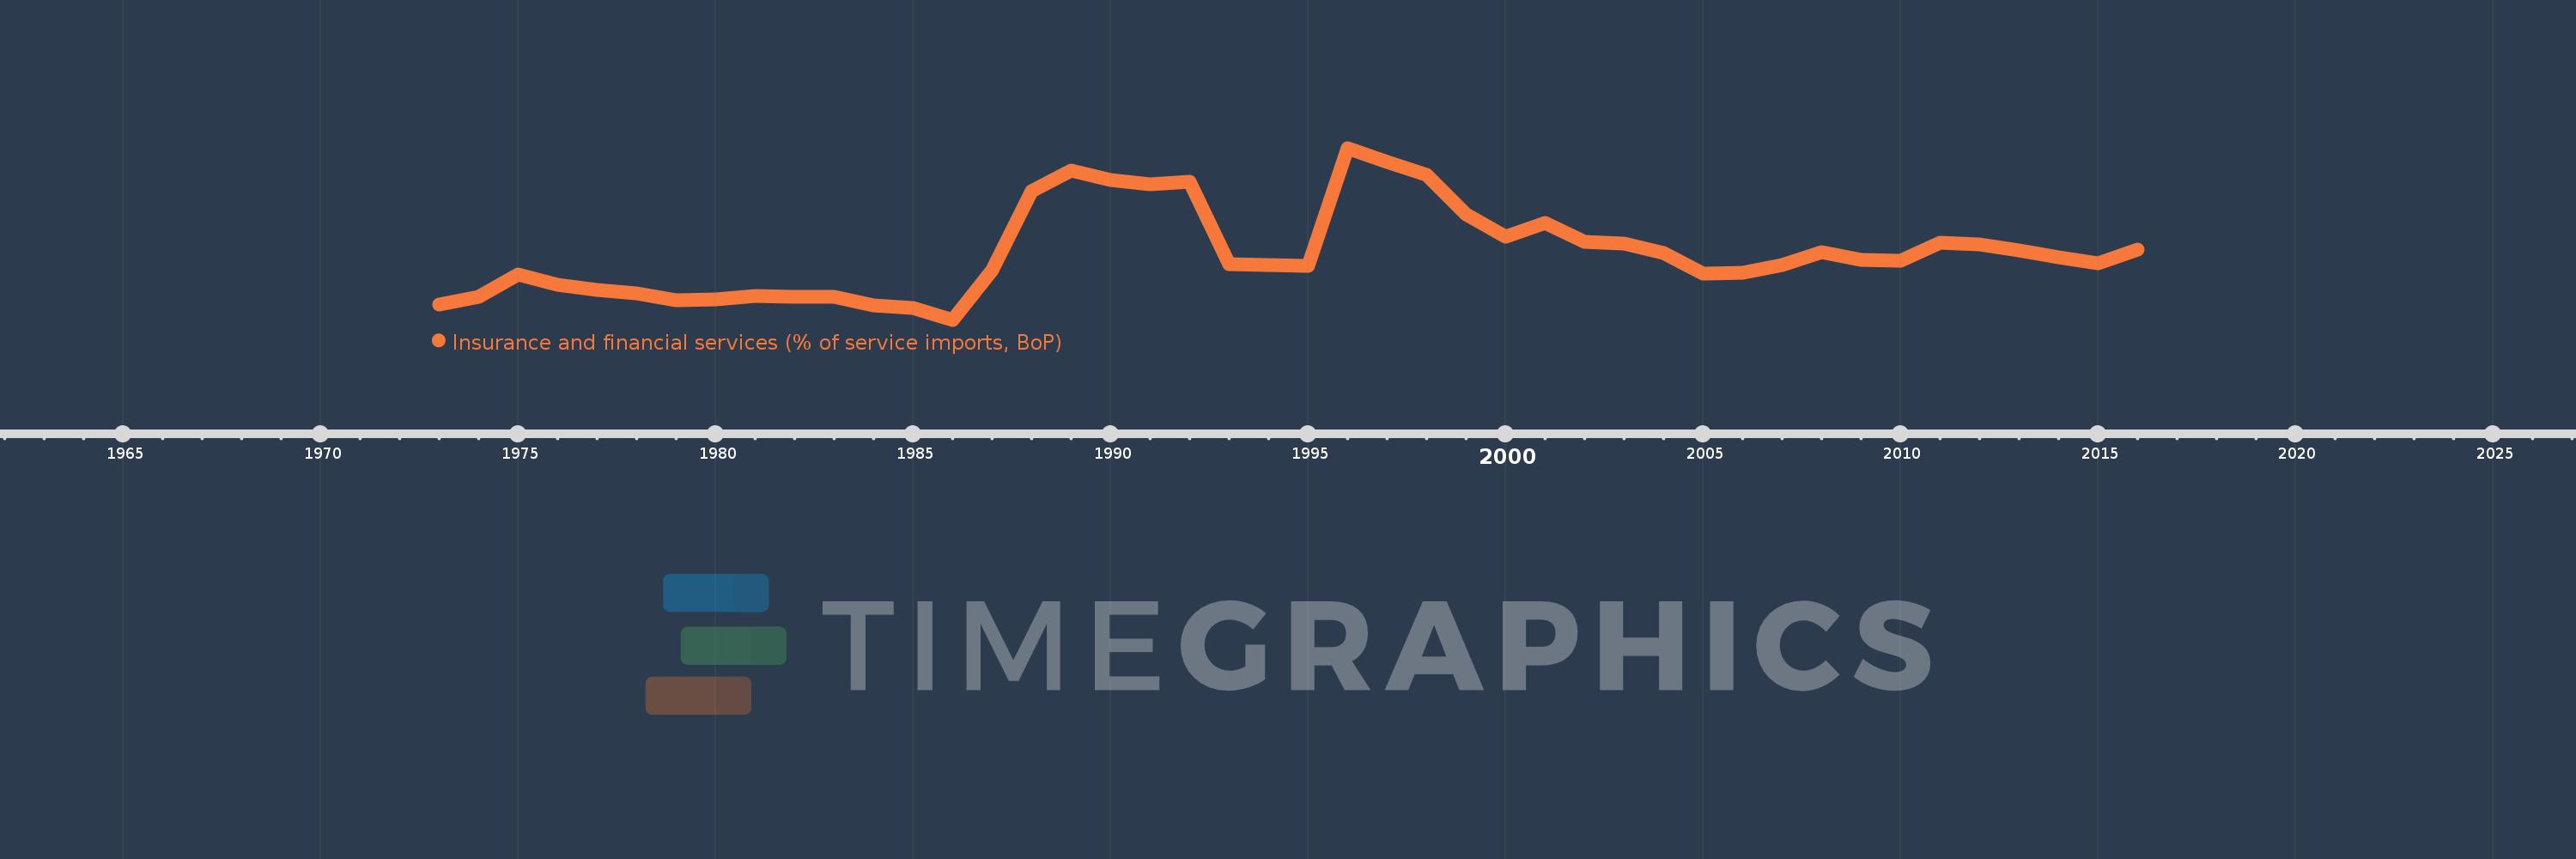
Insurance and financial services (% of service imports, BoP)
2016,2015,2014,2013,2012,2011,2010,2009,2008,2007,2006,2005,2004,2003,2002,2001,2000,1999,1998,1997,1996,1995,1994,1993,1992,1991,1990,1989,1988,1987,1986,1985,1984,1983,1982,1981,1980,1979,1978,1977,1976,1975,1974,1973
This statistics in other country:
AfghanistanAlbaniaAlgeriaAngolaAntigua and BarbudaArab WorldArgentinaArmeniaArubaAustraliaAustriaAzerbaijanBahamas, TheBahrainBangladeshBarbadosBelarusBelgiumBelizeBeninBermudaBhutanBoliviaBosnia and HerzegovinaBotswanaBrazilBrunei DarussalamBulgariaBurkina FasoBurundiCabo VerdeCambodiaCameroonCanadaCaribbean small statesCentral African RepublicCentral Europe and the BalticsChadChileChinaColombiaComorosCongo, Dem. Rep.Congo, Rep.Costa RicaCote d'IvoireCroatiaCuracaoCyprusCzech RepublicDenmarkDjiboutiDominicaDominican RepublicEarly-demographic dividendEast Asia & PacificEast Asia & Pacific (excluding high income)East Asia & Pacific (IDA & IBRD countries)EcuadorEgypt, Arab Rep.El SalvadorEquatorial GuineaEritreaEstoniaEthiopiaEuro areaEurope & Central AsiaEurope & Central Asia (excluding high income)Europe & Central Asia (IDA & IBRD countries)European UnionFaroe IslandsFijiFinlandFragile and conflict affected situationsFranceFrench PolynesiaGabonGambia, TheGeorgiaGermanyGhanaGreeceGrenadaGuatemalaGuineaGuinea-BissauGuyanaHaitiHeavily indebted poor countries (HIPC)High incomeHondurasHong Kong SAR, ChinaHungaryIBRD onlyIcelandIDA & IBRD totalIDA onlyIDA totalIndiaIndonesiaIran, Islamic Rep.IraqIrelandIsraelItalyJamaicaJapanJordanKazakhstanKenyaKiribatiKorea, Rep.KosovoKuwaitKyrgyz RepublicLao PDRLate-demographic dividendLatin America & Caribbean Latin America & Caribbean (excluding high income)Latin America & the Caribbean (IDA & IBRD countries)LatviaLeast developed countries: UN classificationLebanonLesothoLiberiaLibyaLithuaniaLow & middle incomeLow incomeLower middle incomeLuxembourgMacao SAR, ChinaMacedonia, FYRMadagascarMalawiMalaysiaMaldivesMaliMaltaMarshall IslandsMauritaniaMauritiusMexicoMicronesia, Fed. Sts.Middle East & North AfricaMiddle East & North Africa (excluding high income)Middle East & North Africa (IDA & IBRD countries)Middle incomeMoldovaMongoliaMontenegroMoroccoMozambiqueMyanmarNamibiaNepalNetherlandsNew CaledoniaNew ZealandNicaraguaNigerNigeriaNorth AmericaNorwayOECD membersOmanOther small statesPacific island small statesPakistanPalauPanamaPapua New GuineaParaguayPeruPhilippinesPolandPortugalPost-demographic dividendPre-demographic dividendQatarRomaniaRussian FederationRwandaSamoaSao Tome and PrincipeSaudi ArabiaSenegalSerbiaSeychellesSierra LeoneSingaporeSint Maarten (Dutch part)Slovak RepublicSloveniaSmall statesSolomon IslandsSouth AfricaSouth AsiaSouth Asia (IDA & IBRD)South SudanSpainSri LankaSt. Kitts and NevisSt. LuciaSt. Vincent and the GrenadinesSub-Saharan Africa Sub-Saharan Africa (excluding high income)Sub-Saharan Africa (IDA & IBRD countries)SudanSurinameSwazilandSwedenSwitzerlandSyrian Arab RepublicTajikistanTanzaniaThailandTimor-LesteTogoTongaTrinidad and TobagoTunisiaTurkeyTuvaluUgandaUkraineUnited KingdomUnited StatesUpper middle incomeUruguayVanuatuVenezuela, RBWest Bank and GazaWorldYemen, Rep.ZambiaZimbabwe Timeline:
This timeline shows a graph from 1973 to 2016 of Singapore. No data until 1972. Number of actual observations by date: 44.
Source name:
World Development Indicators
Source organization:
International Monetary Fund, Balance of Payments Statistics Yearbook and data files.
Categories, topics:
Economy & Growth, Private Sector, Trade
Last updated:
apr 23, 2017
Indicators value changes by year
Maximum:
10.567
jan 1, 1996
At the date of observation
Value
Absolute change
Change from previous value
jan 1, 1973
3.891
+3.891
0.0%
jan 1, 1974
4.224
+0.332
8.54%
jan 1, 1975
5.15
+0.927
21.94%
jan 1, 1976
4.714
-0.436
-8.47%
jan 1, 1977
4.491
-0.223
-4.72%
jan 1, 1978
4.365
-0.127
-2.82%
jan 1, 1979
4.064
-0.301
-6.89%
jan 1, 1980
4.105
+0.041
1.02%
jan 1, 1981
4.25
+0.145
3.54%
jan 1, 1982
4.219
-0.031
-0.74%
jan 1, 1983
4.23
+0.011
0.26%
jan 1, 1984
3.854
-0.376
-8.89%
jan 1, 1985
3.728
-0.126
-3.26%
jan 1, 1986
3.235
-0.493
-13.22%
jan 1, 1987
5.355
+2.12
65.52%
jan 1, 1988
8.711
+3.355
62.66%
jan 1, 1989
9.6
+0.89
10.21%
jan 1, 1990
9.213
-0.387
-4.03%
jan 1, 1991
9.014
-0.199
-2.16%
jan 1, 1992
9.117
+0.103
1.15%
jan 1, 1993
5.595
-3.522
-38.63%
jan 1, 1994
5.587
-0.008
-0.14%
jan 1, 1995
5.547
-0.04
-0.71%
jan 1, 1996
10.567
+5.019
90.49%
jan 1, 1997
9.953
-0.614
-5.81%
jan 1, 1998
9.424
-0.529
-5.31%
jan 1, 1999
7.737
-1.688
-17.91%
jan 1, 2000
6.769
-0.967
-12.5%
jan 1, 2001
7.374
+0.604
8.93%
jan 1, 2002
6.577
-0.797
-10.81%
jan 1, 2003
6.479
-0.098
-1.49%
jan 1, 2004
6.073
-0.406
-6.26%
jan 1, 2005
5.194
-0.879
-14.48%
jan 1, 2006
5.256
+0.062
1.19%
jan 1, 2007
5.583
+0.327
6.23%
jan 1, 2008
6.107
+0.524
9.38%
jan 1, 2009
5.791
-0.316
-5.17%
jan 1, 2010
5.764
-0.027
-0.46%
jan 1, 2011
6.524
+0.76
13.19%
jan 1, 2012
6.467
-0.058
-0.89%
jan 1, 2013
6.201
-0.265
-4.11%
jan 1, 2014
5.882
-0.319
-5.15%
jan 1, 2015
5.649
-0.233
-3.96%
jan 1, 2016
6.242
+0.593
10.5%
Ranking of countries by current statistics by years


Comments: