29
/
en
AIzaSyAYiBZKx7MnpbEhh9jyipgxe19OcubqV5w
April 1, 2024
286053
Zambia
ZMB
true
2
1
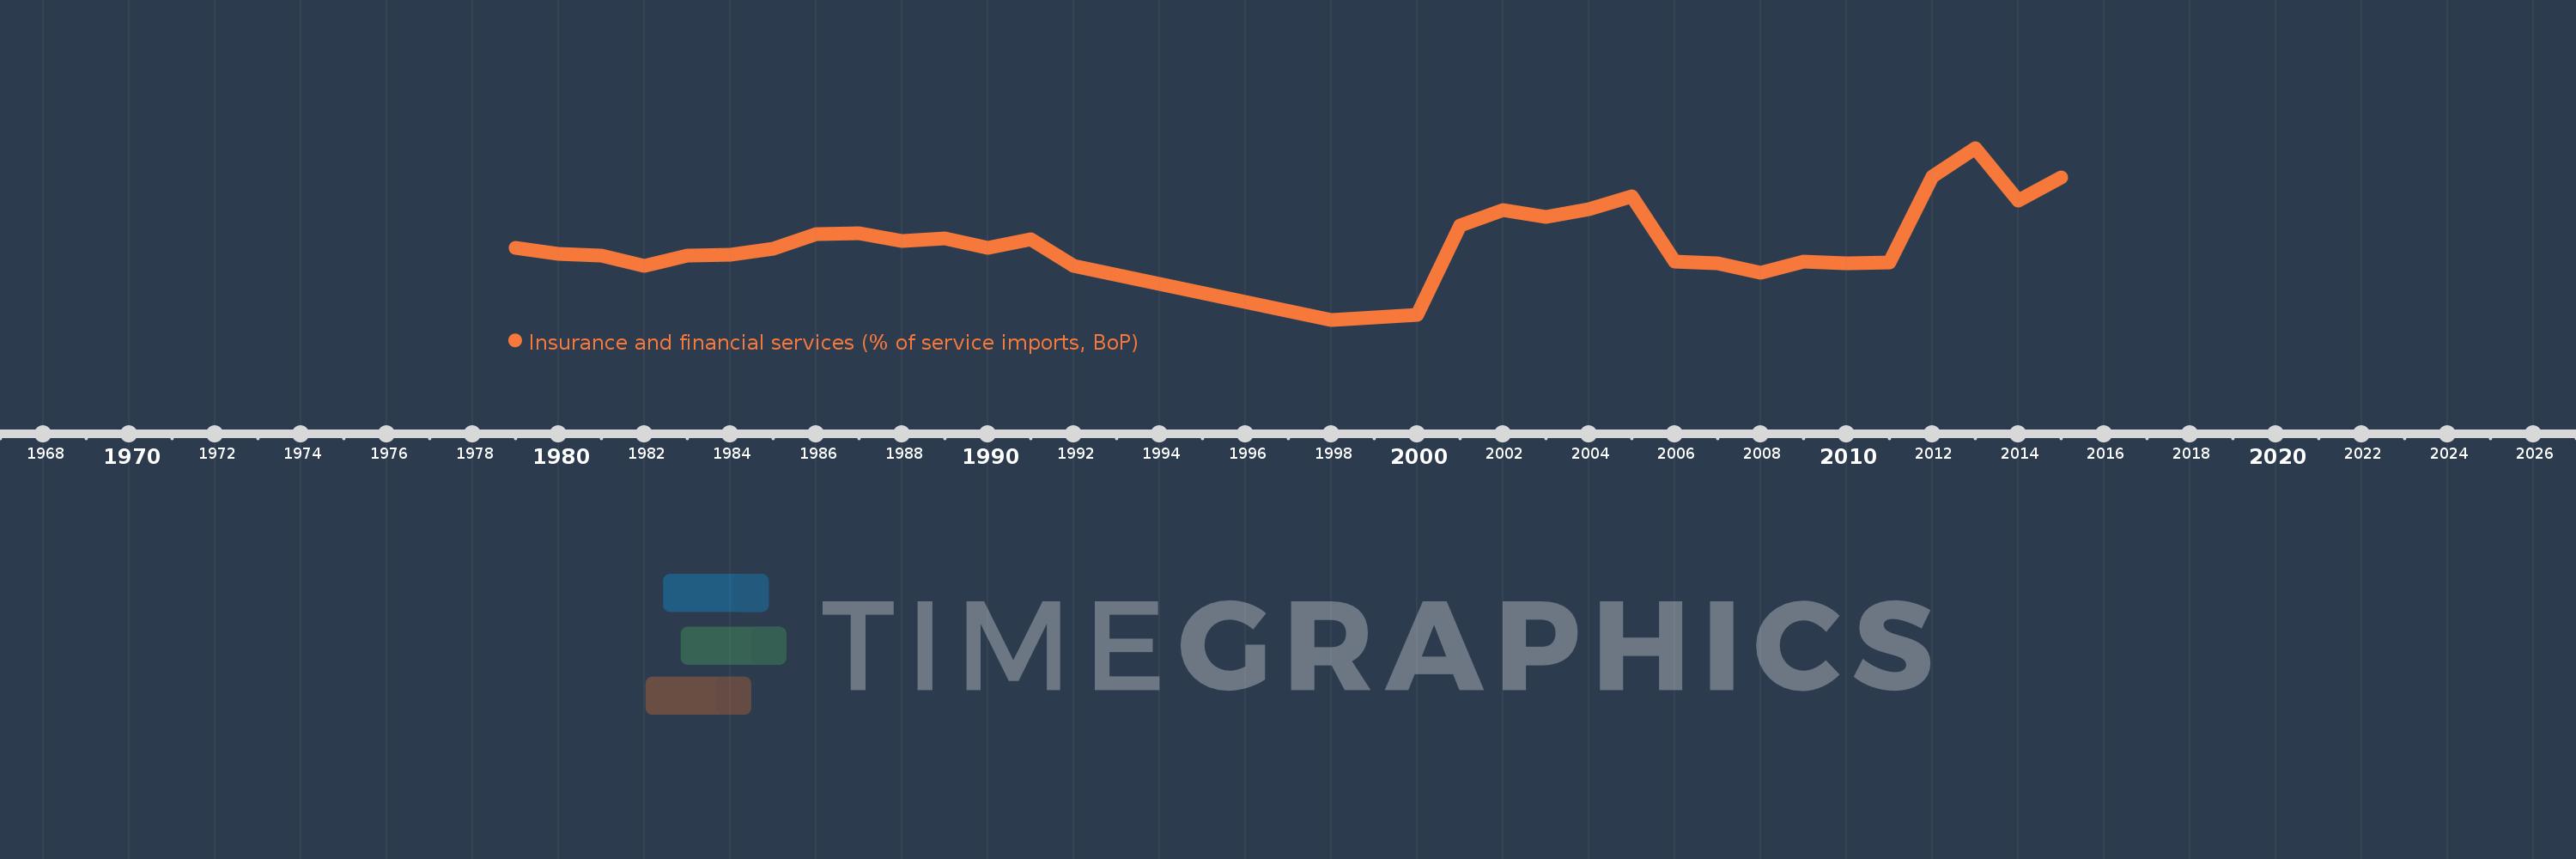
Insurance and financial services (% of service imports, BoP)
2015,2014,2013,2012,2011,2010,2009,2008,2007,2006,2005,2004,2003,2002,2001,2000,1999,1998,1992,1991,1990,1989,1988,1987,1986,1985,1984,1983,1982,1981,1980,1979
This statistics in other country:
AfghanistanAlbaniaAlgeriaAngolaAntigua and BarbudaArab WorldArgentinaArmeniaArubaAustraliaAustriaAzerbaijanBahamas, TheBahrainBangladeshBarbadosBelarusBelgiumBelizeBeninBermudaBhutanBoliviaBosnia and HerzegovinaBotswanaBrazilBrunei DarussalamBulgariaBurkina FasoBurundiCabo VerdeCambodiaCameroonCanadaCaribbean small statesCentral African RepublicCentral Europe and the BalticsChadChileChinaColombiaComorosCongo, Dem. Rep.Congo, Rep.Costa RicaCote d'IvoireCroatiaCuracaoCyprusCzech RepublicDenmarkDjiboutiDominicaDominican RepublicEarly-demographic dividendEast Asia & PacificEast Asia & Pacific (excluding high income)East Asia & Pacific (IDA & IBRD countries)EcuadorEgypt, Arab Rep.El SalvadorEquatorial GuineaEritreaEstoniaEthiopiaEuro areaEurope & Central AsiaEurope & Central Asia (excluding high income)Europe & Central Asia (IDA & IBRD countries)European UnionFaroe IslandsFijiFinlandFragile and conflict affected situationsFranceFrench PolynesiaGabonGambia, TheGeorgiaGermanyGhanaGreeceGrenadaGuatemalaGuineaGuinea-BissauGuyanaHaitiHeavily indebted poor countries (HIPC)High incomeHondurasHong Kong SAR, ChinaHungaryIBRD onlyIcelandIDA & IBRD totalIDA onlyIDA totalIndiaIndonesiaIran, Islamic Rep.IraqIrelandIsraelItalyJamaicaJapanJordanKazakhstanKenyaKiribatiKorea, Rep.KosovoKuwaitKyrgyz RepublicLao PDRLate-demographic dividendLatin America & Caribbean Latin America & Caribbean (excluding high income)Latin America & the Caribbean (IDA & IBRD countries)LatviaLeast developed countries: UN classificationLebanonLesothoLiberiaLibyaLithuaniaLow & middle incomeLow incomeLower middle incomeLuxembourgMacao SAR, ChinaMacedonia, FYRMadagascarMalawiMalaysiaMaldivesMaliMaltaMarshall IslandsMauritaniaMauritiusMexicoMicronesia, Fed. Sts.Middle East & North AfricaMiddle East & North Africa (excluding high income)Middle East & North Africa (IDA & IBRD countries)Middle incomeMoldovaMongoliaMontenegroMoroccoMozambiqueMyanmarNamibiaNepalNetherlandsNew CaledoniaNew ZealandNicaraguaNigerNigeriaNorth AmericaNorwayOECD membersOmanOther small statesPacific island small statesPakistanPalauPanamaPapua New GuineaParaguayPeruPhilippinesPolandPortugalPost-demographic dividendPre-demographic dividendQatarRomaniaRussian FederationRwandaSamoaSao Tome and PrincipeSaudi ArabiaSenegalSerbiaSeychellesSierra LeoneSingaporeSint Maarten (Dutch part)Slovak RepublicSloveniaSmall statesSolomon IslandsSouth AfricaSouth AsiaSouth Asia (IDA & IBRD)South SudanSpainSri LankaSt. Kitts and NevisSt. LuciaSt. Vincent and the GrenadinesSub-Saharan Africa Sub-Saharan Africa (excluding high income)Sub-Saharan Africa (IDA & IBRD countries)SudanSurinameSwazilandSwedenSwitzerlandSyrian Arab RepublicTajikistanTanzaniaThailandTimor-LesteTogoTongaTrinidad and TobagoTunisiaTurkeyTuvaluUgandaUkraineUnited KingdomUnited StatesUpper middle incomeUruguayVanuatuVenezuela, RBWest Bank and GazaWorldYemen, Rep.ZambiaZimbabwe Timeline:
This timeline shows a graph from 1979 to 2015 of Zambia. No data until 1978. Number of actual observations by date: 32.
Source name:
World Development Indicators
Source organization:
International Monetary Fund, Balance of Payments Statistics Yearbook and data files.
Categories, topics:
Economy & Growth, Private Sector, Trade
Last updated:
apr 23, 2017
Indicators value changes by year
Minimum:
-0.035
jan 1, 1998
Maximum:
10.844
jan 1, 2013
At the date of observation
Value
Absolute change
Change from previous value
jan 1, 1979
4.539
+4.539
0.0%
jan 1, 1980
4.145
-0.394
-8.68%
jan 1, 1981
4.039
-0.105
-2.54%
jan 1, 1982
3.37
-0.669
-16.56%
jan 1, 1983
4.014
+0.643
19.09%
jan 1, 1984
4.102
+0.088
2.19%
jan 1, 1985
4.475
+0.373
9.1%
jan 1, 1986
5.383
+0.908
20.29%
jan 1, 1987
5.433
+0.049
0.92%
jan 1, 1988
4.978
-0.455
-8.38%
jan 1, 1989
5.119
+0.142
2.85%
jan 1, 1990
4.528
-0.591
-11.55%
jan 1, 1991
5.051
+0.522
11.54%
jan 1, 1992
3.39
-1.66
-32.87%
jan 1, 1998
-0.035
-3.426
-101.05%
jan 1, 1999
0.108
+0.143
-403.99%
jan 1, 2000
0.294
+0.186
172.73%
jan 1, 2001
5.917
+5.623
1.91K%
jan 1, 2002
6.901
+0.984
16.63%
jan 1, 2003
6.483
-0.417
-6.05%
jan 1, 2004
6.966
+0.482
7.44%
jan 1, 2005
7.802
+0.837
12.01%
jan 1, 2006
3.624
-4.178
-53.55%
jan 1, 2007
3.535
-0.089
-2.45%
jan 1, 2008
2.925
-0.611
-17.28%
jan 1, 2009
3.626
+0.701
23.98%
jan 1, 2010
3.536
-0.09
-2.49%
jan 1, 2011
3.614
+0.078
2.21%
jan 1, 2012
9.025
+5.412
149.76%
jan 1, 2013
10.844
+1.818
20.15%
jan 1, 2014
7.517
-3.327
-30.68%
jan 1, 2015
8.952
+1.436
19.1%
Ranking of countries by current statistics by years


Comments: