29
/
en
AIzaSyAYiBZKx7MnpbEhh9jyipgxe19OcubqV5w
April 1, 2024
58201
South Asia (IDA & IBRD)
TSA
false
2
1
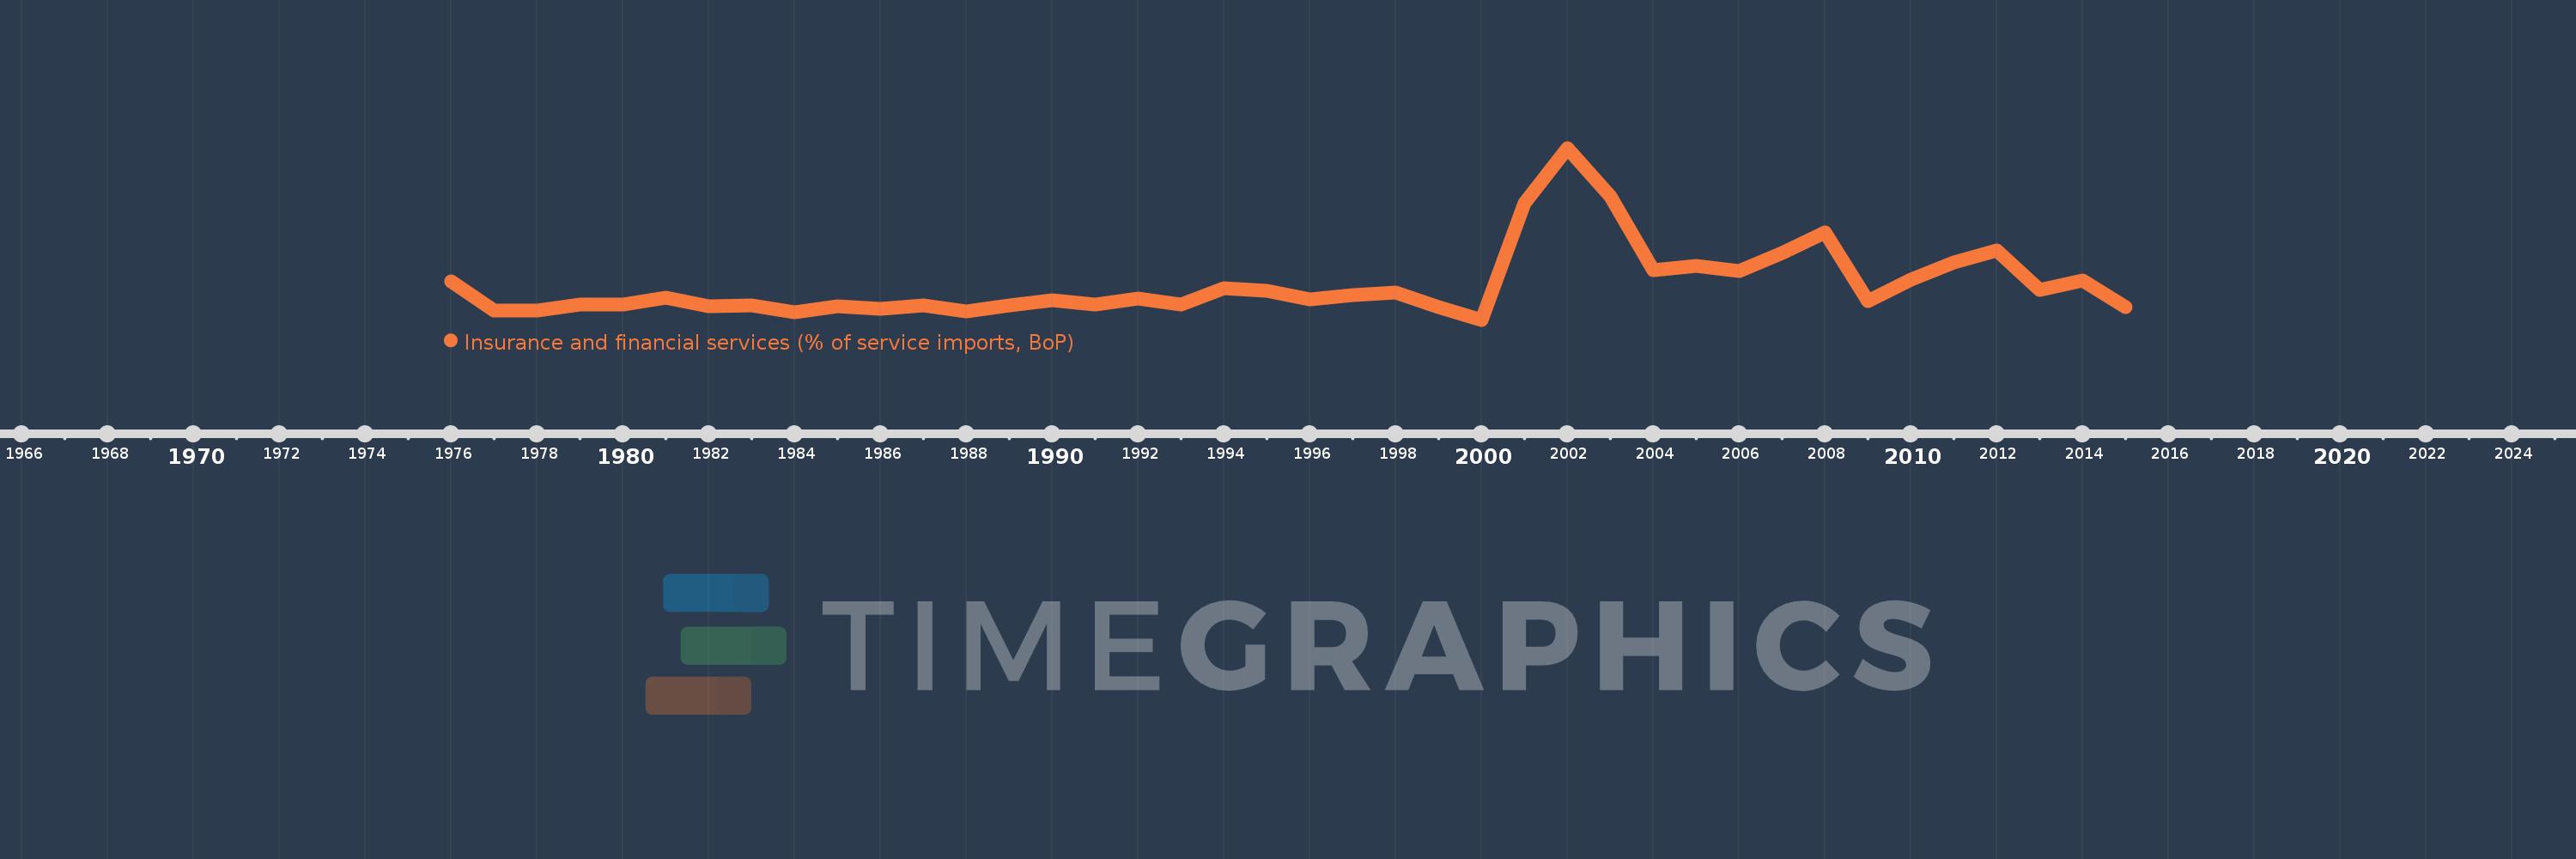
Insurance and financial services (% of service imports, BoP)
2015,2014,2013,2012,2011,2010,2009,2008,2007,2006,2005,2004,2003,2002,2001,2000,1999,1998,1997,1996,1995,1994,1993,1992,1991,1990,1989,1988,1987,1986,1985,1984,1983,1982,1981,1980,1979,1978,1977,1976
This statistics in other country:
AfghanistanAlbaniaAlgeriaAngolaAntigua and BarbudaArab WorldArgentinaArmeniaArubaAustraliaAustriaAzerbaijanBahamas, TheBahrainBangladeshBarbadosBelarusBelgiumBelizeBeninBermudaBhutanBoliviaBosnia and HerzegovinaBotswanaBrazilBrunei DarussalamBulgariaBurkina FasoBurundiCabo VerdeCambodiaCameroonCanadaCaribbean small statesCentral African RepublicCentral Europe and the BalticsChadChileChinaColombiaComorosCongo, Dem. Rep.Congo, Rep.Costa RicaCote d'IvoireCroatiaCuracaoCyprusCzech RepublicDenmarkDjiboutiDominicaDominican RepublicEarly-demographic dividendEast Asia & PacificEast Asia & Pacific (excluding high income)East Asia & Pacific (IDA & IBRD countries)EcuadorEgypt, Arab Rep.El SalvadorEquatorial GuineaEritreaEstoniaEthiopiaEuro areaEurope & Central AsiaEurope & Central Asia (excluding high income)Europe & Central Asia (IDA & IBRD countries)European UnionFaroe IslandsFijiFinlandFragile and conflict affected situationsFranceFrench PolynesiaGabonGambia, TheGeorgiaGermanyGhanaGreeceGrenadaGuatemalaGuineaGuinea-BissauGuyanaHaitiHeavily indebted poor countries (HIPC)High incomeHondurasHong Kong SAR, ChinaHungaryIBRD onlyIcelandIDA & IBRD totalIDA onlyIDA totalIndiaIndonesiaIran, Islamic Rep.IraqIrelandIsraelItalyJamaicaJapanJordanKazakhstanKenyaKiribatiKorea, Rep.KosovoKuwaitKyrgyz RepublicLao PDRLate-demographic dividendLatin America & Caribbean Latin America & Caribbean (excluding high income)Latin America & the Caribbean (IDA & IBRD countries)LatviaLeast developed countries: UN classificationLebanonLesothoLiberiaLibyaLithuaniaLow & middle incomeLow incomeLower middle incomeLuxembourgMacao SAR, ChinaMacedonia, FYRMadagascarMalawiMalaysiaMaldivesMaliMaltaMarshall IslandsMauritaniaMauritiusMexicoMicronesia, Fed. Sts.Middle East & North AfricaMiddle East & North Africa (excluding high income)Middle East & North Africa (IDA & IBRD countries)Middle incomeMoldovaMongoliaMontenegroMoroccoMozambiqueMyanmarNamibiaNepalNetherlandsNew CaledoniaNew ZealandNicaraguaNigerNigeriaNorth AmericaNorwayOECD membersOmanOther small statesPacific island small statesPakistanPalauPanamaPapua New GuineaParaguayPeruPhilippinesPolandPortugalPost-demographic dividendPre-demographic dividendQatarRomaniaRussian FederationRwandaSamoaSao Tome and PrincipeSaudi ArabiaSenegalSerbiaSeychellesSierra LeoneSingaporeSint Maarten (Dutch part)Slovak RepublicSloveniaSmall statesSolomon IslandsSouth AfricaSouth AsiaSouth Asia (IDA & IBRD)South SudanSpainSri LankaSt. Kitts and NevisSt. LuciaSt. Vincent and the GrenadinesSub-Saharan Africa Sub-Saharan Africa (excluding high income)Sub-Saharan Africa (IDA & IBRD countries)SudanSurinameSwazilandSwedenSwitzerlandSyrian Arab RepublicTajikistanTanzaniaThailandTimor-LesteTogoTongaTrinidad and TobagoTunisiaTurkeyTuvaluUgandaUkraineUnited KingdomUnited StatesUpper middle incomeUruguayVanuatuVenezuela, RBWest Bank and GazaWorldYemen, Rep.ZambiaZimbabwe Timeline:
This timeline shows a graph from 1976 to 2015 of South Asia (IDA & IBRD). No data until 1975. Number of actual observations by date: 40.
Source name:
World Development Indicators
Source organization:
International Monetary Fund, Balance of Payments Statistics Yearbook and data files.
Categories, topics:
Economy & Growth, Private Sector, Trade
Last updated:
apr 23, 2017
Indicators value changes by year
At the date of observation
Value
Absolute change
Change from previous value
jan 1, 1976
5.835
+5.835
0.0%
jan 1, 1977
4.406
-1.429
-24.49%
jan 1, 1978
4.372
-0.034
-0.77%
jan 1, 1979
4.682
+0.311
7.11%
jan 1, 1980
4.689
+0.007
0.15%
jan 1, 1981
5.01
+0.321
6.85%
jan 1, 1982
4.593
-0.417
-8.33%
jan 1, 1983
4.648
+0.055
1.19%
jan 1, 1984
4.302
-0.345
-7.43%
jan 1, 1985
4.62
+0.318
7.39%
jan 1, 1986
4.453
-0.167
-3.61%
jan 1, 1987
4.643
+0.189
4.25%
jan 1, 1988
4.364
-0.279
-6.0%
jan 1, 1989
4.648
+0.284
6.5%
jan 1, 1990
4.888
+0.241
5.18%
jan 1, 1991
4.674
-0.214
-4.37%
jan 1, 1992
4.981
+0.306
6.56%
jan 1, 1993
4.685
-0.296
-5.94%
jan 1, 1994
5.503
+0.817
17.45%
jan 1, 1995
5.358
-0.144
-2.62%
jan 1, 1996
4.938
-0.42
-7.84%
jan 1, 1997
5.134
+0.196
3.96%
jan 1, 1998
5.281
+0.147
2.87%
jan 1, 1999
4.565
-0.717
-13.57%
jan 1, 2000
3.936
-0.628
-13.77%
jan 1, 2001
9.673
+5.737
145.74%
jan 1, 2002
12.39
+2.717
28.09%
jan 1, 2003
10.029
-2.362
-19.06%
jan 1, 2004
6.39
-3.639
-36.28%
jan 1, 2005
6.6
+0.209
3.28%
jan 1, 2006
6.319
-0.28
-4.25%
jan 1, 2007
7.222
+0.903
14.29%
jan 1, 2008
8.221
+0.999
13.83%
jan 1, 2009
4.857
-3.364
-40.92%
jan 1, 2010
5.901
+1.044
21.5%
jan 1, 2011
6.748
+0.847
14.36%
jan 1, 2012
7.341
+0.593
8.78%
jan 1, 2013
5.421
-1.921
-26.16%
jan 1, 2014
5.872
+0.452
8.33%
jan 1, 2015
4.549
-1.323
-22.53%
Ranking of countries by current statistics by years


Comments: