29
/
en
AIzaSyAYiBZKx7MnpbEhh9jyipgxe19OcubqV5w
April 1, 2024
39721
IDA total
IDA
false
2
1
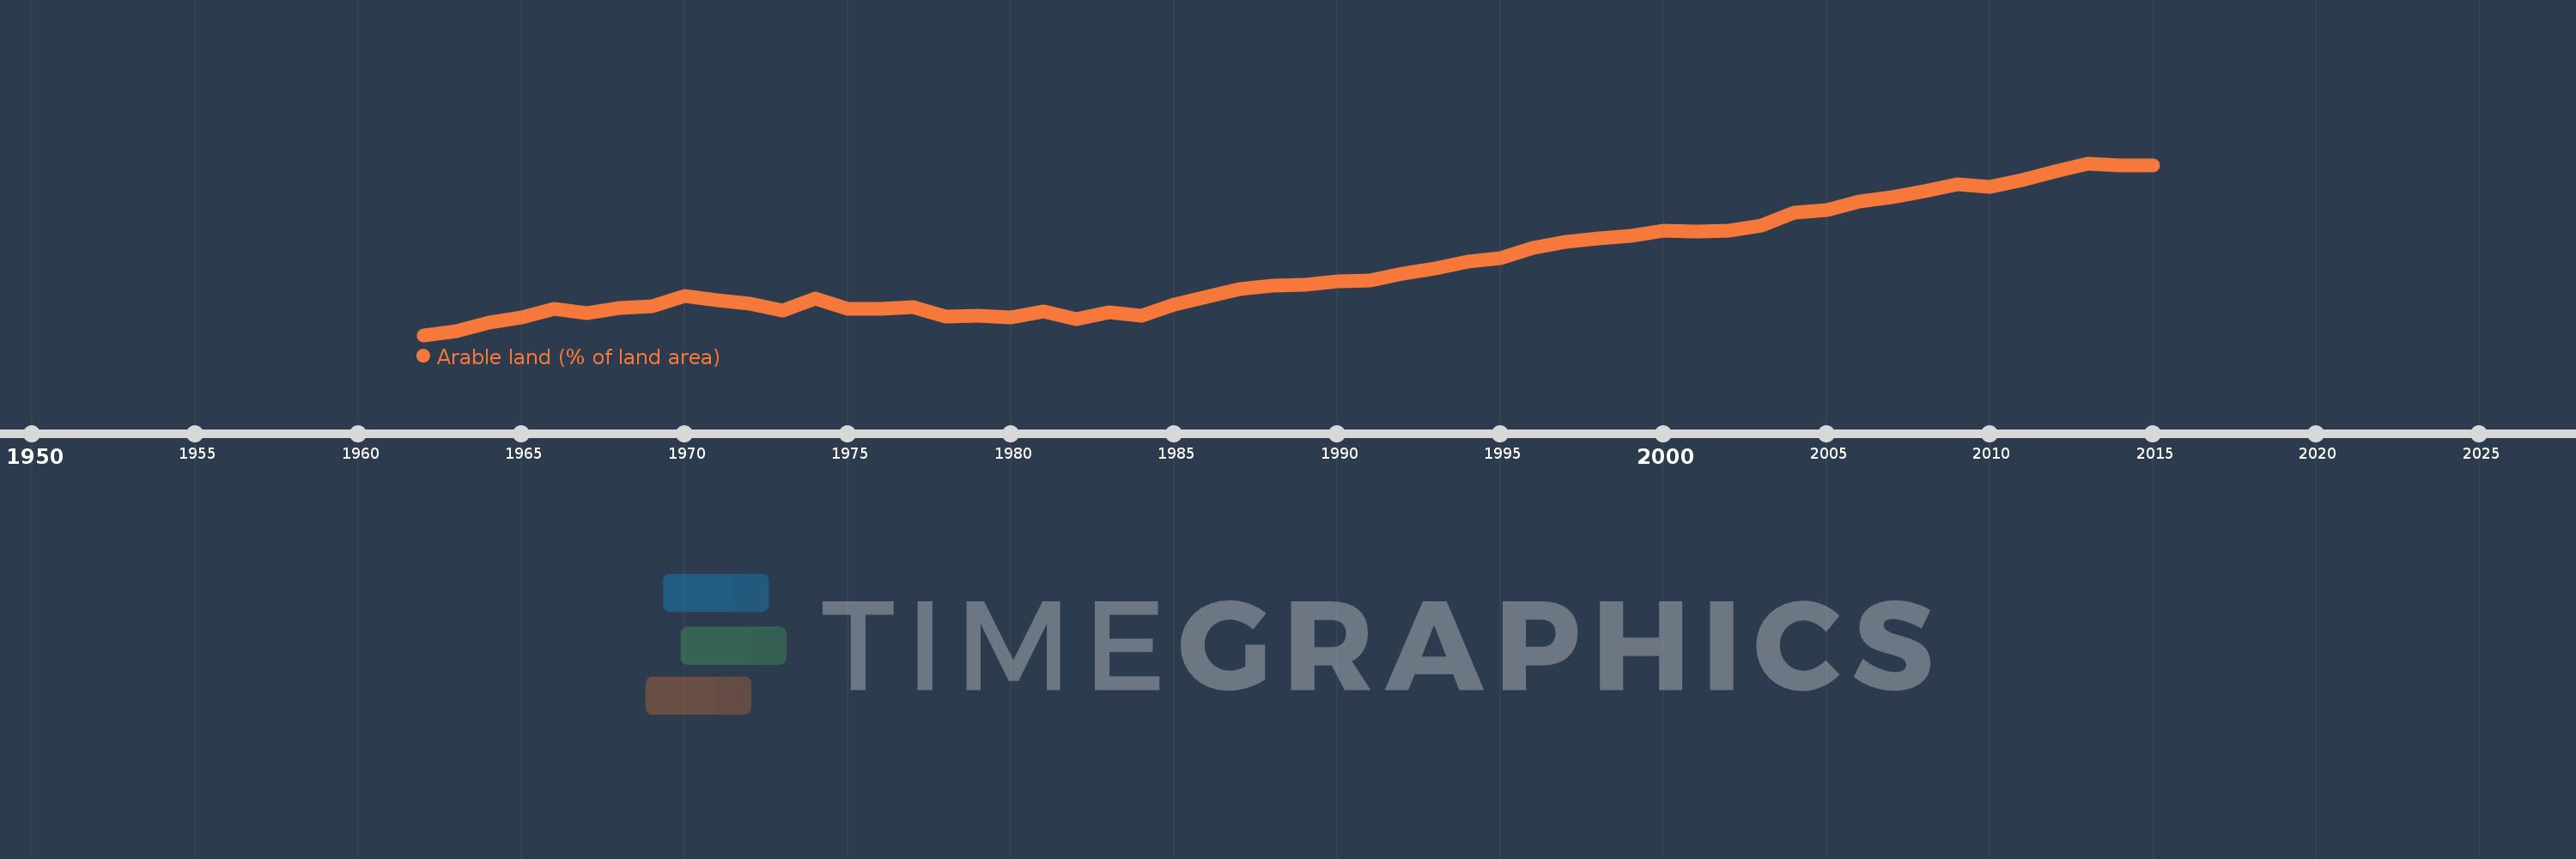
Arable land (% of land area)
2015,2014,2013,2012,2011,2010,2009,2008,2007,2006,2005,2004,2003,2002,2001,2000,1999,1998,1997,1996,1995,1994,1993,1992,1991,1990,1989,1988,1987,1986,1985,1984,1983,1982,1981,1980,1979,1978,1977,1976,1975,1974,1973,1972,1971,1970,1969,1968,1967,1966,1965,1964,1963,1962
This statistics in other country:
AfghanistanAlbaniaAlgeriaAmerican SamoaAndorraAngolaAntigua and BarbudaArab WorldArgentinaArmeniaArubaAustraliaAustriaAzerbaijanBahamas, TheBahrainBangladeshBarbadosBelarusBelgiumBelizeBeninBermudaBhutanBoliviaBosnia and HerzegovinaBotswanaBrazilBritish Virgin IslandsBrunei DarussalamBulgariaBurkina FasoBurundiCabo VerdeCambodiaCameroonCanadaCaribbean small statesCayman IslandsCentral African RepublicCentral Europe and the BalticsChadChannel IslandsChileChinaColombiaComorosCongo, Dem. Rep.Congo, Rep.Costa RicaCote d'IvoireCroatiaCubaCyprusCzech RepublicDenmarkDjiboutiDominicaDominican RepublicEarly-demographic dividendEast Asia & PacificEast Asia & Pacific (excluding high income)East Asia & Pacific (IDA & IBRD countries)EcuadorEgypt, Arab Rep.El SalvadorEquatorial GuineaEritreaEstoniaEthiopiaEuro areaEurope & Central AsiaEurope & Central Asia (excluding high income)Europe & Central Asia (IDA & IBRD countries)European UnionFaroe IslandsFijiFinlandFragile and conflict affected situationsFranceFrench PolynesiaGabonGambia, TheGeorgiaGermanyGhanaGreeceGreenlandGrenadaGuamGuatemalaGuineaGuinea-BissauGuyanaHaitiHeavily indebted poor countries (HIPC)High incomeHondurasHong Kong SAR, ChinaHungaryIBRD onlyIcelandIDA & IBRD totalIDA blendIDA onlyIDA totalIndiaIndonesiaIran, Islamic Rep.IraqIrelandIsle of ManIsraelItalyJamaicaJapanJordanKazakhstanKenyaKiribatiKorea, Dem. People’s Rep.Korea, Rep.KosovoKuwaitKyrgyz RepublicLao PDRLate-demographic dividendLatin America & Caribbean Latin America & Caribbean (excluding high income)Latin America & the Caribbean (IDA & IBRD countries)LatviaLeast developed countries: UN classificationLebanonLesothoLiberiaLibyaLiechtensteinLithuaniaLow & middle incomeLow incomeLower middle incomeLuxembourgMacedonia, FYRMadagascarMalawiMalaysiaMaldivesMaliMaltaMarshall IslandsMauritaniaMauritiusMexicoMicronesia, Fed. Sts.Middle East & North AfricaMiddle East & North Africa (excluding high income)Middle East & North Africa (IDA & IBRD countries)Middle incomeMoldovaMongoliaMontenegroMoroccoMozambiqueMyanmarNamibiaNepalNetherlandsNew CaledoniaNew ZealandNicaraguaNigerNigeriaNorth AmericaNorthern Mariana IslandsNorwayOECD membersOmanOther small statesPacific island small statesPakistanPalauPanamaPapua New GuineaParaguayPeruPhilippinesPolandPortugalPost-demographic dividendPre-demographic dividendPuerto RicoQatarRomaniaRussian FederationRwandaSamoaSan MarinoSao Tome and PrincipeSaudi ArabiaSenegalSerbiaSeychellesSierra LeoneSingaporeSlovak RepublicSloveniaSmall statesSolomon IslandsSomaliaSouth AfricaSouth AsiaSouth Asia (IDA & IBRD)SpainSri LankaSt. Kitts and NevisSt. LuciaSt. Vincent and the GrenadinesSub-Saharan Africa Sub-Saharan Africa (excluding high income)Sub-Saharan Africa (IDA & IBRD countries)SudanSurinameSwazilandSwedenSwitzerlandSyrian Arab RepublicTajikistanTanzaniaThailandTimor-LesteTogoTongaTrinidad and TobagoTunisiaTurkeyTurkmenistanTurks and Caicos IslandsUgandaUkraineUnited Arab EmiratesUnited KingdomUnited StatesUpper middle incomeUruguayUzbekistanVanuatuVenezuela, RBVietnamVirgin Islands (U.S.)West Bank and GazaWorldYemen, Rep.ZambiaZimbabwe Timeline:
This timeline shows a graph from 1962 to 2015 of IDA total. No data until 1961. Number of actual observations by date: 54.
Source name:
World Development Indicators
Source organization:
Food and Agriculture Organization, electronic files and web site.
Categories, topics:
Agriculture & Rural Development, Climate Change, Environment
Last updated:
apr 23, 2017
Indicators value changes by year
Maximum:
10.393
jan 1, 2013
At the date of observation
Value
Absolute change
Change from previous value
jan 1, 1962
7.295
+7.295
0.0%
jan 1, 1963
7.363
+0.067
0.92%
jan 1, 1964
7.523
+0.16
2.18%
jan 1, 1965
7.618
+0.095
1.27%
jan 1, 1966
7.767
+0.148
1.95%
jan 1, 1967
7.688
-0.079
-1.01%
jan 1, 1968
7.79
+0.102
1.33%
jan 1, 1969
7.821
+0.03
0.39%
jan 1, 1970
8.0
+0.179
2.3%
jan 1, 1971
7.921
-0.079
-0.99%
jan 1, 1972
7.853
-0.067
-0.85%
jan 1, 1973
7.741
-0.112
-1.43%
jan 1, 1974
7.948
+0.207
2.68%
jan 1, 1975
7.766
-0.183
-2.3%
jan 1, 1976
7.764
-0.002
-0.03%
jan 1, 1977
7.805
+0.042
0.54%
jan 1, 1978
7.624
-0.181
-2.32%
jan 1, 1979
7.642
+0.018
0.23%
jan 1, 1980
7.606
-0.036
-0.47%
jan 1, 1981
7.728
+0.122
1.6%
jan 1, 1982
7.575
-0.153
-1.98%
jan 1, 1983
7.706
+0.131
1.73%
jan 1, 1984
7.65
-0.057
-0.73%
jan 1, 1985
7.839
+0.19
2.48%
jan 1, 1986
7.985
+0.146
1.86%
jan 1, 1987
8.127
+0.142
1.78%
jan 1, 1988
8.186
+0.058
0.72%
jan 1, 1989
8.201
+0.015
0.19%
jan 1, 1990
8.256
+0.055
0.68%
jan 1, 1991
8.285
+0.029
0.35%
jan 1, 1992
8.4
+0.114
1.38%
jan 1, 1993
8.492
+0.092
1.09%
jan 1, 1994
8.623
+0.131
1.54%
jan 1, 1995
8.681
+0.058
0.67%
jan 1, 1996
8.866
+0.185
2.13%
jan 1, 1997
8.968
+0.102
1.15%
jan 1, 1998
9.037
+0.069
0.77%
jan 1, 1999
9.083
+0.045
0.5%
jan 1, 2000
9.181
+0.098
1.08%
jan 1, 2001
9.167
-0.014
-0.15%
jan 1, 2002
9.174
+0.007
0.08%
jan 1, 2003
9.273
+0.099
1.07%
jan 1, 2004
9.509
+0.237
2.55%
jan 1, 2005
9.547
+0.038
0.4%
jan 1, 2006
9.711
+0.164
1.72%
jan 1, 2007
9.781
+0.07
0.72%
jan 1, 2008
9.89
+0.109
1.11%
jan 1, 2009
10.007
+0.117
1.19%
jan 1, 2010
9.963
-0.044
-0.44%
jan 1, 2011
10.088
+0.125
1.25%
jan 1, 2012
10.25
+0.162
1.61%
jan 1, 2013
10.393
+0.142
1.39%
jan 1, 2014
10.356
-0.037
-0.35%
jan 1, 2015
10.354
-0.002
-0.02%
Ranking of countries by current statistics by years


Comments: