29
/
en
AIzaSyAYiBZKx7MnpbEhh9jyipgxe19OcubqV5w
April 1, 2024
163521
Japan
JPN
true
2
1
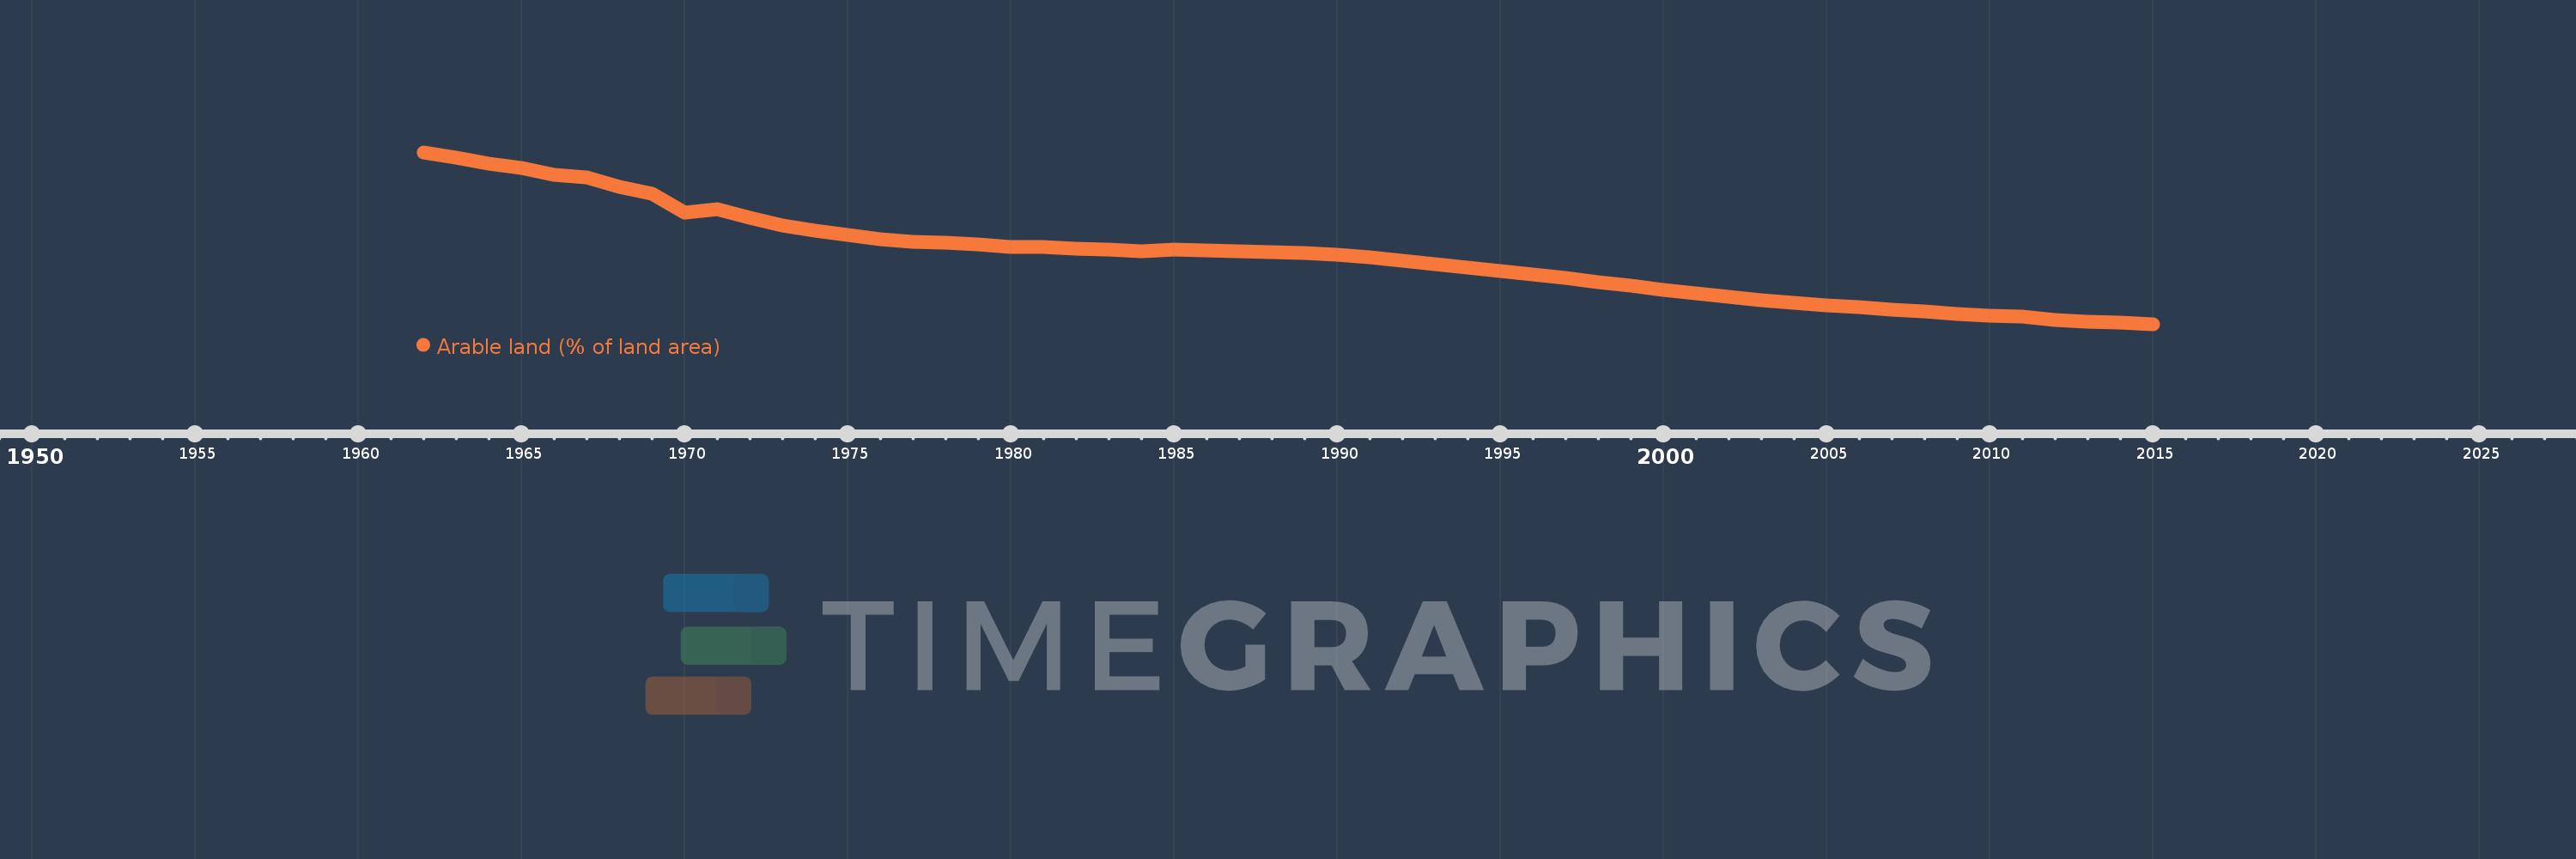
Arable land (% of land area)
2015,2014,2013,2012,2011,2010,2009,2008,2007,2006,2005,2004,2003,2002,2001,2000,1999,1998,1997,1996,1995,1994,1993,1992,1991,1990,1989,1988,1987,1986,1985,1984,1983,1982,1981,1980,1979,1978,1977,1976,1975,1974,1973,1972,1971,1970,1969,1968,1967,1966,1965,1964,1963,1962
This statistics in other country:
AfghanistanAlbaniaAlgeriaAmerican SamoaAndorraAngolaAntigua and BarbudaArab WorldArgentinaArmeniaArubaAustraliaAustriaAzerbaijanBahamas, TheBahrainBangladeshBarbadosBelarusBelgiumBelizeBeninBermudaBhutanBoliviaBosnia and HerzegovinaBotswanaBrazilBritish Virgin IslandsBrunei DarussalamBulgariaBurkina FasoBurundiCabo VerdeCambodiaCameroonCanadaCaribbean small statesCayman IslandsCentral African RepublicCentral Europe and the BalticsChadChannel IslandsChileChinaColombiaComorosCongo, Dem. Rep.Congo, Rep.Costa RicaCote d'IvoireCroatiaCubaCyprusCzech RepublicDenmarkDjiboutiDominicaDominican RepublicEarly-demographic dividendEast Asia & PacificEast Asia & Pacific (excluding high income)East Asia & Pacific (IDA & IBRD countries)EcuadorEgypt, Arab Rep.El SalvadorEquatorial GuineaEritreaEstoniaEthiopiaEuro areaEurope & Central AsiaEurope & Central Asia (excluding high income)Europe & Central Asia (IDA & IBRD countries)European UnionFaroe IslandsFijiFinlandFragile and conflict affected situationsFranceFrench PolynesiaGabonGambia, TheGeorgiaGermanyGhanaGreeceGreenlandGrenadaGuamGuatemalaGuineaGuinea-BissauGuyanaHaitiHeavily indebted poor countries (HIPC)High incomeHondurasHong Kong SAR, ChinaHungaryIBRD onlyIcelandIDA & IBRD totalIDA blendIDA onlyIDA totalIndiaIndonesiaIran, Islamic Rep.IraqIrelandIsle of ManIsraelItalyJamaicaJapanJordanKazakhstanKenyaKiribatiKorea, Dem. People’s Rep.Korea, Rep.KosovoKuwaitKyrgyz RepublicLao PDRLate-demographic dividendLatin America & Caribbean Latin America & Caribbean (excluding high income)Latin America & the Caribbean (IDA & IBRD countries)LatviaLeast developed countries: UN classificationLebanonLesothoLiberiaLibyaLiechtensteinLithuaniaLow & middle incomeLow incomeLower middle incomeLuxembourgMacedonia, FYRMadagascarMalawiMalaysiaMaldivesMaliMaltaMarshall IslandsMauritaniaMauritiusMexicoMicronesia, Fed. Sts.Middle East & North AfricaMiddle East & North Africa (excluding high income)Middle East & North Africa (IDA & IBRD countries)Middle incomeMoldovaMongoliaMontenegroMoroccoMozambiqueMyanmarNamibiaNepalNetherlandsNew CaledoniaNew ZealandNicaraguaNigerNigeriaNorth AmericaNorthern Mariana IslandsNorwayOECD membersOmanOther small statesPacific island small statesPakistanPalauPanamaPapua New GuineaParaguayPeruPhilippinesPolandPortugalPost-demographic dividendPre-demographic dividendPuerto RicoQatarRomaniaRussian FederationRwandaSamoaSan MarinoSao Tome and PrincipeSaudi ArabiaSenegalSerbiaSeychellesSierra LeoneSingaporeSlovak RepublicSloveniaSmall statesSolomon IslandsSomaliaSouth AfricaSouth AsiaSouth Asia (IDA & IBRD)SpainSri LankaSt. Kitts and NevisSt. LuciaSt. Vincent and the GrenadinesSub-Saharan Africa Sub-Saharan Africa (excluding high income)Sub-Saharan Africa (IDA & IBRD countries)SudanSurinameSwazilandSwedenSwitzerlandSyrian Arab RepublicTajikistanTanzaniaThailandTimor-LesteTogoTongaTrinidad and TobagoTunisiaTurkeyTurkmenistanTurks and Caicos IslandsUgandaUkraineUnited Arab EmiratesUnited KingdomUnited StatesUpper middle incomeUruguayUzbekistanVanuatuVenezuela, RBVietnamVirgin Islands (U.S.)West Bank and GazaWorldYemen, Rep.ZambiaZimbabwe Timeline:
This timeline shows a graph from 1962 to 2015 of Japan. No data until 1961. Number of actual observations by date: 54.
Source name:
World Development Indicators
Source organization:
Food and Agriculture Organization, electronic files and web site.
Categories, topics:
Agriculture & Rural Development, Climate Change, Environment
Last updated:
apr 23, 2017
Indicators value changes by year
Minimum:
11.584
jan 1, 2015
Maximum:
15.435
jan 1, 1962
At the date of observation
Value
Absolute change
Change from previous value
jan 1, 1962
15.435
+15.435
0.0%
jan 1, 1963
15.326
-0.109
-0.71%
jan 1, 1964
15.19
-0.136
-0.89%
jan 1, 1965
15.08
-0.109
-0.72%
jan 1, 1966
14.939
-0.142
-0.94%
jan 1, 1967
14.87
-0.068
-0.46%
jan 1, 1968
14.663
-0.207
-1.39%
jan 1, 1969
14.508
-0.155
-1.06%
jan 1, 1970
14.077
-0.431
-2.97%
jan 1, 1971
14.17
+0.093
0.66%
jan 1, 1972
13.976
-0.194
-1.37%
jan 1, 1973
13.794
-0.182
-1.3%
jan 1, 1974
13.68
-0.115
-0.83%
jan 1, 1975
13.579
-0.101
-0.74%
jan 1, 1976
13.492
-0.086
-0.64%
jan 1, 1977
13.427
-0.065
-0.49%
jan 1, 1978
13.403
-0.024
-0.18%
jan 1, 1979
13.368
-0.035
-0.26%
jan 1, 1980
13.324
-0.044
-0.33%
jan 1, 1981
13.306
-0.018
-0.14%
jan 1, 1982
13.267
-0.039
-0.29%
jan 1, 1983
13.25
-0.017
-0.13%
jan 1, 1984
13.225
-0.025
-0.19%
jan 1, 1985
13.26
+0.035
0.27%
jan 1, 1986
13.247
-0.013
-0.1%
jan 1, 1987
13.216
-0.031
-0.23%
jan 1, 1988
13.204
-0.013
-0.1%
jan 1, 1989
13.182
-0.022
-0.17%
jan 1, 1990
13.143
-0.038
-0.29%
jan 1, 1991
13.077
-0.066
-0.5%
jan 1, 1992
13.001
-0.077
-0.59%
jan 1, 1993
12.929
-0.071
-0.55%
jan 1, 1994
12.85
-0.08
-0.62%
jan 1, 1995
12.781
-0.069
-0.53%
jan 1, 1996
12.699
-0.082
-0.64%
jan 1, 1997
12.626
-0.073
-0.58%
jan 1, 1998
12.535
-0.091
-0.72%
jan 1, 1999
12.442
-0.093
-0.74%
jan 1, 2000
12.354
-0.088
-0.71%
jan 1, 2001
12.274
-0.08
-0.64%
jan 1, 2002
12.192
-0.082
-0.67%
jan 1, 2003
12.123
-0.069
-0.56%
jan 1, 2004
12.063
-0.06
-0.5%
jan 1, 2005
12.014
-0.049
-0.41%
jan 1, 2006
11.962
-0.052
-0.43%
jan 1, 2007
11.915
-0.047
-0.39%
jan 1, 2008
11.868
-0.047
-0.39%
jan 1, 2009
11.819
-0.049
-0.42%
jan 1, 2010
11.781
-0.038
-0.32%
jan 1, 2011
11.746
-0.035
-0.29%
jan 1, 2012
11.669
-0.077
-0.66%
jan 1, 2013
11.647
-0.022
-0.19%
jan 1, 2014
11.622
-0.025
-0.21%
jan 1, 2015
11.584
-0.038
-0.33%
Ranking of countries by current statistics by years


Comments: