29
/
en
AIzaSyAYiBZKx7MnpbEhh9jyipgxe19OcubqV5w
April 1, 2024
206400
Nepal
NPL
true
2
1
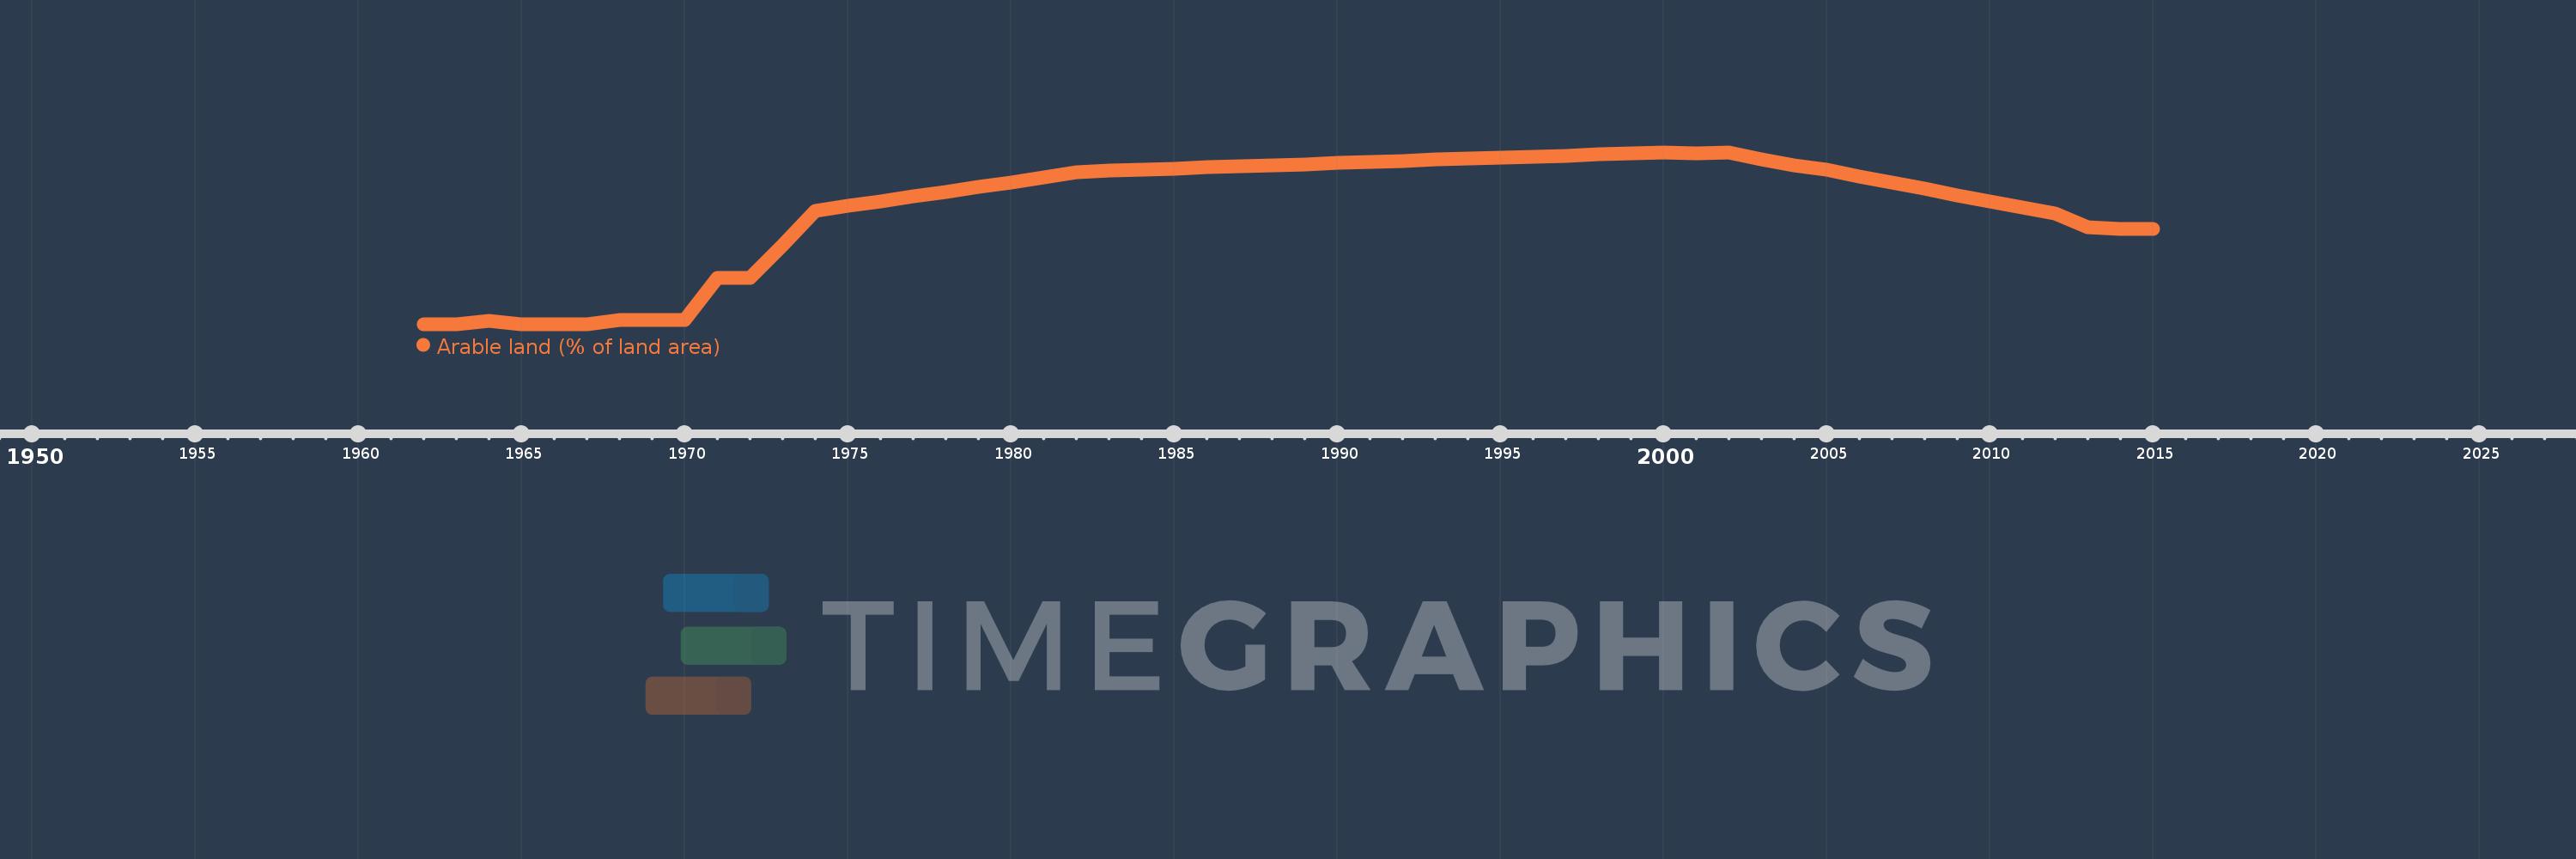
Arable land (% of land area)
2015,2014,2013,2012,2011,2010,2009,2008,2007,2006,2005,2004,2003,2002,2001,2000,1999,1998,1997,1996,1995,1994,1993,1992,1991,1990,1989,1988,1987,1986,1985,1984,1983,1982,1981,1980,1979,1978,1977,1976,1975,1974,1973,1972,1971,1970,1969,1968,1967,1966,1965,1964,1963,1962
This statistics in other country:
AfghanistanAlbaniaAlgeriaAmerican SamoaAndorraAngolaAntigua and BarbudaArab WorldArgentinaArmeniaArubaAustraliaAustriaAzerbaijanBahamas, TheBahrainBangladeshBarbadosBelarusBelgiumBelizeBeninBermudaBhutanBoliviaBosnia and HerzegovinaBotswanaBrazilBritish Virgin IslandsBrunei DarussalamBulgariaBurkina FasoBurundiCabo VerdeCambodiaCameroonCanadaCaribbean small statesCayman IslandsCentral African RepublicCentral Europe and the BalticsChadChannel IslandsChileChinaColombiaComorosCongo, Dem. Rep.Congo, Rep.Costa RicaCote d'IvoireCroatiaCubaCyprusCzech RepublicDenmarkDjiboutiDominicaDominican RepublicEarly-demographic dividendEast Asia & PacificEast Asia & Pacific (excluding high income)East Asia & Pacific (IDA & IBRD countries)EcuadorEgypt, Arab Rep.El SalvadorEquatorial GuineaEritreaEstoniaEthiopiaEuro areaEurope & Central AsiaEurope & Central Asia (excluding high income)Europe & Central Asia (IDA & IBRD countries)European UnionFaroe IslandsFijiFinlandFragile and conflict affected situationsFranceFrench PolynesiaGabonGambia, TheGeorgiaGermanyGhanaGreeceGreenlandGrenadaGuamGuatemalaGuineaGuinea-BissauGuyanaHaitiHeavily indebted poor countries (HIPC)High incomeHondurasHong Kong SAR, ChinaHungaryIBRD onlyIcelandIDA & IBRD totalIDA blendIDA onlyIDA totalIndiaIndonesiaIran, Islamic Rep.IraqIrelandIsle of ManIsraelItalyJamaicaJapanJordanKazakhstanKenyaKiribatiKorea, Dem. People’s Rep.Korea, Rep.KosovoKuwaitKyrgyz RepublicLao PDRLate-demographic dividendLatin America & Caribbean Latin America & Caribbean (excluding high income)Latin America & the Caribbean (IDA & IBRD countries)LatviaLeast developed countries: UN classificationLebanonLesothoLiberiaLibyaLiechtensteinLithuaniaLow & middle incomeLow incomeLower middle incomeLuxembourgMacedonia, FYRMadagascarMalawiMalaysiaMaldivesMaliMaltaMarshall IslandsMauritaniaMauritiusMexicoMicronesia, Fed. Sts.Middle East & North AfricaMiddle East & North Africa (excluding high income)Middle East & North Africa (IDA & IBRD countries)Middle incomeMoldovaMongoliaMontenegroMoroccoMozambiqueMyanmarNamibiaNepalNetherlandsNew CaledoniaNew ZealandNicaraguaNigerNigeriaNorth AmericaNorthern Mariana IslandsNorwayOECD membersOmanOther small statesPacific island small statesPakistanPalauPanamaPapua New GuineaParaguayPeruPhilippinesPolandPortugalPost-demographic dividendPre-demographic dividendPuerto RicoQatarRomaniaRussian FederationRwandaSamoaSan MarinoSao Tome and PrincipeSaudi ArabiaSenegalSerbiaSeychellesSierra LeoneSingaporeSlovak RepublicSloveniaSmall statesSolomon IslandsSomaliaSouth AfricaSouth AsiaSouth Asia (IDA & IBRD)SpainSri LankaSt. Kitts and NevisSt. LuciaSt. Vincent and the GrenadinesSub-Saharan Africa Sub-Saharan Africa (excluding high income)Sub-Saharan Africa (IDA & IBRD countries)SudanSurinameSwazilandSwedenSwitzerlandSyrian Arab RepublicTajikistanTanzaniaThailandTimor-LesteTogoTongaTrinidad and TobagoTunisiaTurkeyTurkmenistanTurks and Caicos IslandsUgandaUkraineUnited Arab EmiratesUnited KingdomUnited StatesUpper middle incomeUruguayUzbekistanVanuatuVenezuela, RBVietnamVirgin Islands (U.S.)West Bank and GazaWorldYemen, Rep.ZambiaZimbabwe Timeline:
This timeline shows a graph from 1962 to 2015 of Nepal. No data until 1961. Number of actual observations by date: 54.
Source name:
World Development Indicators
Source organization:
Food and Agriculture Organization, electronic files and web site.
Categories, topics:
Agriculture & Rural Development, Climate Change, Environment
Last updated:
apr 23, 2017
Indicators value changes by year
Minimum:
12.629
jan 1, 1962
Maximum:
16.436
jan 1, 2000
At the date of observation
Value
Absolute change
Change from previous value
jan 1, 1962
12.629
+12.629
0.0%
jan 1, 1963
12.629
0.0
0.0%
jan 1, 1964
12.699
+0.07
0.55%
jan 1, 1965
12.629
-0.07
-0.55%
jan 1, 1966
12.629
0.0
0.0%
jan 1, 1967
12.629
0.0
0.0%
jan 1, 1968
12.72
+0.091
0.72%
jan 1, 1969
12.72
0.0
0.0%
jan 1, 1970
12.72
0.0
0.0%
jan 1, 1971
13.657
+0.937
7.37%
jan 1, 1972
13.657
0.0
0.0%
jan 1, 1973
14.371
+0.713
5.22%
jan 1, 1974
15.14
+0.769
5.35%
jan 1, 1975
15.245
+0.105
0.69%
jan 1, 1976
15.35
+0.105
0.69%
jan 1, 1977
15.455
+0.105
0.68%
jan 1, 1978
15.559
+0.105
0.68%
jan 1, 1979
15.664
+0.105
0.67%
jan 1, 1980
15.769
+0.105
0.67%
jan 1, 1981
15.874
+0.105
0.67%
jan 1, 1982
16.0
+0.126
0.79%
jan 1, 1983
16.025
+0.025
0.16%
jan 1, 1984
16.05
+0.025
0.16%
jan 1, 1985
16.076
+0.025
0.16%
jan 1, 1986
16.101
+0.025
0.16%
jan 1, 1987
16.126
+0.025
0.16%
jan 1, 1988
16.151
+0.025
0.16%
jan 1, 1989
16.176
+0.025
0.16%
jan 1, 1990
16.201
+0.025
0.16%
jan 1, 1991
16.227
+0.025
0.16%
jan 1, 1992
16.252
+0.025
0.16%
jan 1, 1993
16.275
+0.023
0.14%
jan 1, 1994
16.298
+0.023
0.14%
jan 1, 1995
16.321
+0.023
0.14%
jan 1, 1996
16.344
+0.023
0.14%
jan 1, 1997
16.367
+0.023
0.14%
jan 1, 1998
16.39
+0.023
0.14%
jan 1, 1999
16.413
+0.023
0.14%
jan 1, 2000
16.436
+0.023
0.14%
jan 1, 2001
16.421
-0.015
-0.09%
jan 1, 2002
16.428
+0.007
0.04%
jan 1, 2003
16.289
-0.14
-0.85%
jan 1, 2004
16.149
-0.14
-0.86%
jan 1, 2005
16.045
-0.105
-0.65%
jan 1, 2006
15.905
-0.14
-0.87%
jan 1, 2007
15.766
-0.14
-0.88%
jan 1, 2008
15.626
-0.14
-0.88%
jan 1, 2009
15.487
-0.14
-0.89%
jan 1, 2010
15.347
-0.14
-0.9%
jan 1, 2011
15.208
-0.14
-0.91%
jan 1, 2012
15.087
-0.121
-0.79%
jan 1, 2013
14.775
-0.312
-2.07%
jan 1, 2014
14.747
-0.028
-0.19%
jan 1, 2015
14.745
-0.002
-0.01%
Ranking of countries by current statistics by years


Comments: