29
/
en
AIzaSyAYiBZKx7MnpbEhh9jyipgxe19OcubqV5w
April 1, 2024
104572
Chile
CHL
true
2
1
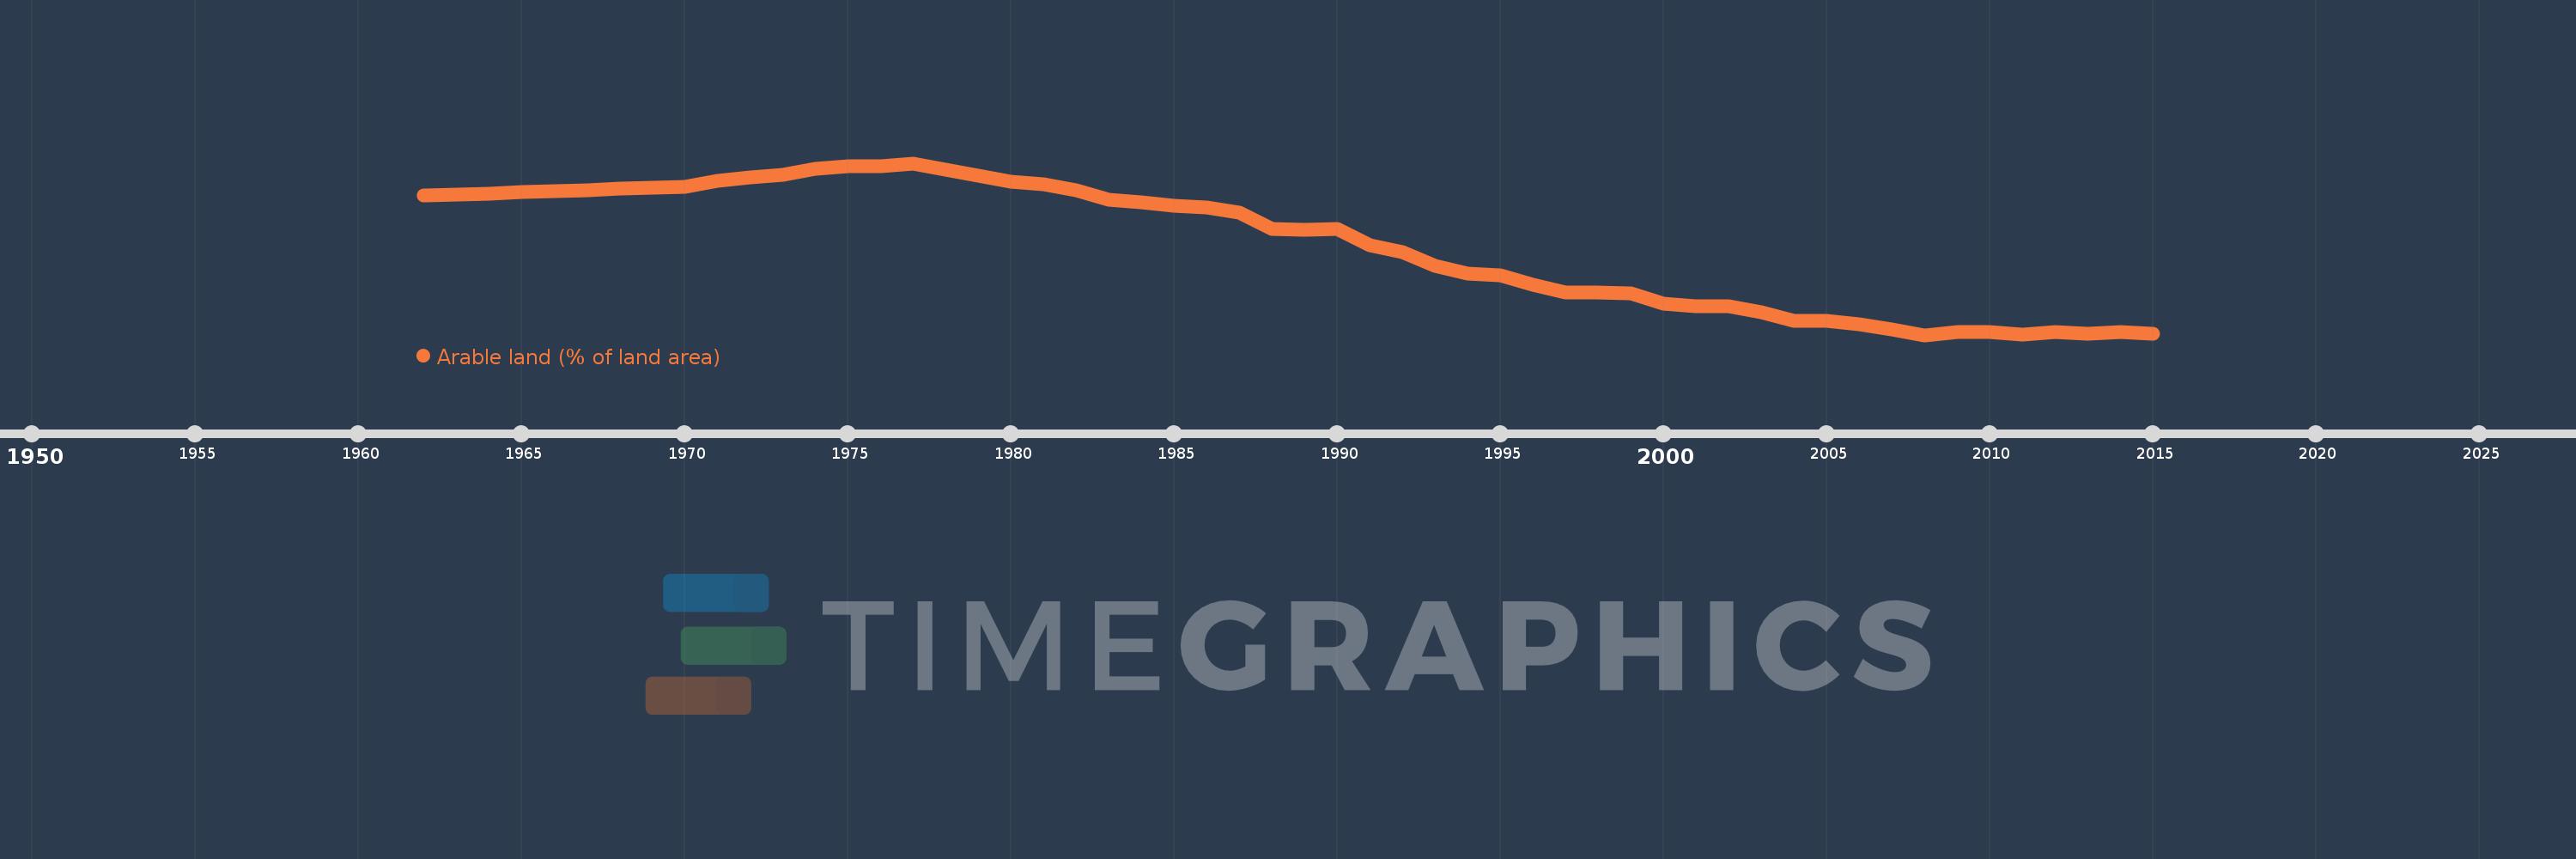
Arable land (% of land area)
2015,2014,2013,2012,2011,2010,2009,2008,2007,2006,2005,2004,2003,2002,2001,2000,1999,1998,1997,1996,1995,1994,1993,1992,1991,1990,1989,1988,1987,1986,1985,1984,1983,1982,1981,1980,1979,1978,1977,1976,1975,1974,1973,1972,1971,1970,1969,1968,1967,1966,1965,1964,1963,1962
This statistics in other country:
AfghanistanAlbaniaAlgeriaAmerican SamoaAndorraAngolaAntigua and BarbudaArab WorldArgentinaArmeniaArubaAustraliaAustriaAzerbaijanBahamas, TheBahrainBangladeshBarbadosBelarusBelgiumBelizeBeninBermudaBhutanBoliviaBosnia and HerzegovinaBotswanaBrazilBritish Virgin IslandsBrunei DarussalamBulgariaBurkina FasoBurundiCabo VerdeCambodiaCameroonCanadaCaribbean small statesCayman IslandsCentral African RepublicCentral Europe and the BalticsChadChannel IslandsChileChinaColombiaComorosCongo, Dem. Rep.Congo, Rep.Costa RicaCote d'IvoireCroatiaCubaCyprusCzech RepublicDenmarkDjiboutiDominicaDominican RepublicEarly-demographic dividendEast Asia & PacificEast Asia & Pacific (excluding high income)East Asia & Pacific (IDA & IBRD countries)EcuadorEgypt, Arab Rep.El SalvadorEquatorial GuineaEritreaEstoniaEthiopiaEuro areaEurope & Central AsiaEurope & Central Asia (excluding high income)Europe & Central Asia (IDA & IBRD countries)European UnionFaroe IslandsFijiFinlandFragile and conflict affected situationsFranceFrench PolynesiaGabonGambia, TheGeorgiaGermanyGhanaGreeceGreenlandGrenadaGuamGuatemalaGuineaGuinea-BissauGuyanaHaitiHeavily indebted poor countries (HIPC)High incomeHondurasHong Kong SAR, ChinaHungaryIBRD onlyIcelandIDA & IBRD totalIDA blendIDA onlyIDA totalIndiaIndonesiaIran, Islamic Rep.IraqIrelandIsle of ManIsraelItalyJamaicaJapanJordanKazakhstanKenyaKiribatiKorea, Dem. People’s Rep.Korea, Rep.KosovoKuwaitKyrgyz RepublicLao PDRLate-demographic dividendLatin America & Caribbean Latin America & Caribbean (excluding high income)Latin America & the Caribbean (IDA & IBRD countries)LatviaLeast developed countries: UN classificationLebanonLesothoLiberiaLibyaLiechtensteinLithuaniaLow & middle incomeLow incomeLower middle incomeLuxembourgMacedonia, FYRMadagascarMalawiMalaysiaMaldivesMaliMaltaMarshall IslandsMauritaniaMauritiusMexicoMicronesia, Fed. Sts.Middle East & North AfricaMiddle East & North Africa (excluding high income)Middle East & North Africa (IDA & IBRD countries)Middle incomeMoldovaMongoliaMontenegroMoroccoMozambiqueMyanmarNamibiaNepalNetherlandsNew CaledoniaNew ZealandNicaraguaNigerNigeriaNorth AmericaNorthern Mariana IslandsNorwayOECD membersOmanOther small statesPacific island small statesPakistanPalauPanamaPapua New GuineaParaguayPeruPhilippinesPolandPortugalPost-demographic dividendPre-demographic dividendPuerto RicoQatarRomaniaRussian FederationRwandaSamoaSan MarinoSao Tome and PrincipeSaudi ArabiaSenegalSerbiaSeychellesSierra LeoneSingaporeSlovak RepublicSloveniaSmall statesSolomon IslandsSomaliaSouth AfricaSouth AsiaSouth Asia (IDA & IBRD)SpainSri LankaSt. Kitts and NevisSt. LuciaSt. Vincent and the GrenadinesSub-Saharan Africa Sub-Saharan Africa (excluding high income)Sub-Saharan Africa (IDA & IBRD countries)SudanSurinameSwazilandSwedenSwitzerlandSyrian Arab RepublicTajikistanTanzaniaThailandTimor-LesteTogoTongaTrinidad and TobagoTunisiaTurkeyTurkmenistanTurks and Caicos IslandsUgandaUkraineUnited Arab EmiratesUnited KingdomUnited StatesUpper middle incomeUruguayUzbekistanVanuatuVenezuela, RBVietnamVirgin Islands (U.S.)West Bank and GazaWorldYemen, Rep.ZambiaZimbabwe Timeline:
This timeline shows a graph from 1962 to 2015 of Chile. No data until 1961. Number of actual observations by date: 54.
Source name:
World Development Indicators
Source organization:
Food and Agriculture Organization, electronic files and web site.
Categories, topics:
Agriculture & Rural Development, Climate Change, Environment
Last updated:
apr 23, 2017
Indicators value changes by year
At the date of observation
Value
Absolute change
Change from previous value
jan 1, 1962
4.896
+4.896
0.0%
jan 1, 1963
4.922
+0.027
0.55%
jan 1, 1964
4.949
+0.027
0.55%
jan 1, 1965
4.976
+0.027
0.54%
jan 1, 1966
5.003
+0.027
0.54%
jan 1, 1967
5.03
+0.027
0.54%
jan 1, 1968
5.057
+0.027
0.53%
jan 1, 1969
5.084
+0.027
0.53%
jan 1, 1970
5.111
+0.027
0.53%
jan 1, 1971
5.248
+0.137
2.68%
jan 1, 1972
5.315
+0.067
1.28%
jan 1, 1973
5.382
+0.067
1.27%
jan 1, 1974
5.517
+0.134
2.5%
jan 1, 1975
5.584
+0.067
1.22%
jan 1, 1976
5.584
0.0
0.0%
jan 1, 1977
5.646
+0.062
1.11%
jan 1, 1978
5.507
-0.139
-2.45%
jan 1, 1979
5.369
-0.139
-2.52%
jan 1, 1980
5.23
-0.139
-2.58%
jan 1, 1981
5.159
-0.071
-1.36%
jan 1, 1982
5.021
-0.139
-2.69%
jan 1, 1983
4.815
-0.206
-4.1%
jan 1, 1984
4.745
-0.07
-1.45%
jan 1, 1985
4.674
-0.071
-1.5%
jan 1, 1986
4.632
-0.042
-0.89%
jan 1, 1987
4.511
-0.121
-2.61%
jan 1, 1988
4.137
-0.374
-8.29%
jan 1, 1989
4.114
-0.023
-0.55%
jan 1, 1990
4.129
+0.015
0.36%
jan 1, 1991
3.768
-0.36
-8.73%
jan 1, 1992
3.611
-0.157
-4.18%
jan 1, 1993
3.282
-0.33
-9.12%
jan 1, 1994
3.099
-0.183
-5.57%
jan 1, 1995
3.061
-0.038
-1.22%
jan 1, 1996
2.851
-0.21
-6.85%
jan 1, 1997
2.67
-0.182
-6.37%
jan 1, 1998
2.666
-0.004
-0.15%
jan 1, 1999
2.662
-0.004
-0.15%
jan 1, 2000
2.421
-0.241
-9.04%
jan 1, 2001
2.354
-0.067
-2.78%
jan 1, 2002
2.354
0.0
0.0%
jan 1, 2003
2.219
-0.134
-5.71%
jan 1, 2004
2.017
-0.202
-9.09%
jan 1, 2005
2.017
0.0
0.0%
jan 1, 2006
1.95
-0.067
-3.33%
jan 1, 2007
1.816
-0.134
-6.9%
jan 1, 2008
1.697
-0.118
-6.52%
jan 1, 2009
1.765
+0.067
3.96%
jan 1, 2010
1.762
-0.003
-0.15%
jan 1, 2011
1.709
-0.052
-2.98%
jan 1, 2012
1.771
+0.062
3.62%
jan 1, 2013
1.726
-0.046
-2.58%
jan 1, 2014
1.761
+0.035
2.03%
jan 1, 2015
1.734
-0.027
-1.51%
Ranking of countries by current statistics by years


Comments: