29
/
en
AIzaSyAYiBZKx7MnpbEhh9jyipgxe19OcubqV5w
April 1, 2024
45863
Low income
LIC
false
2
1
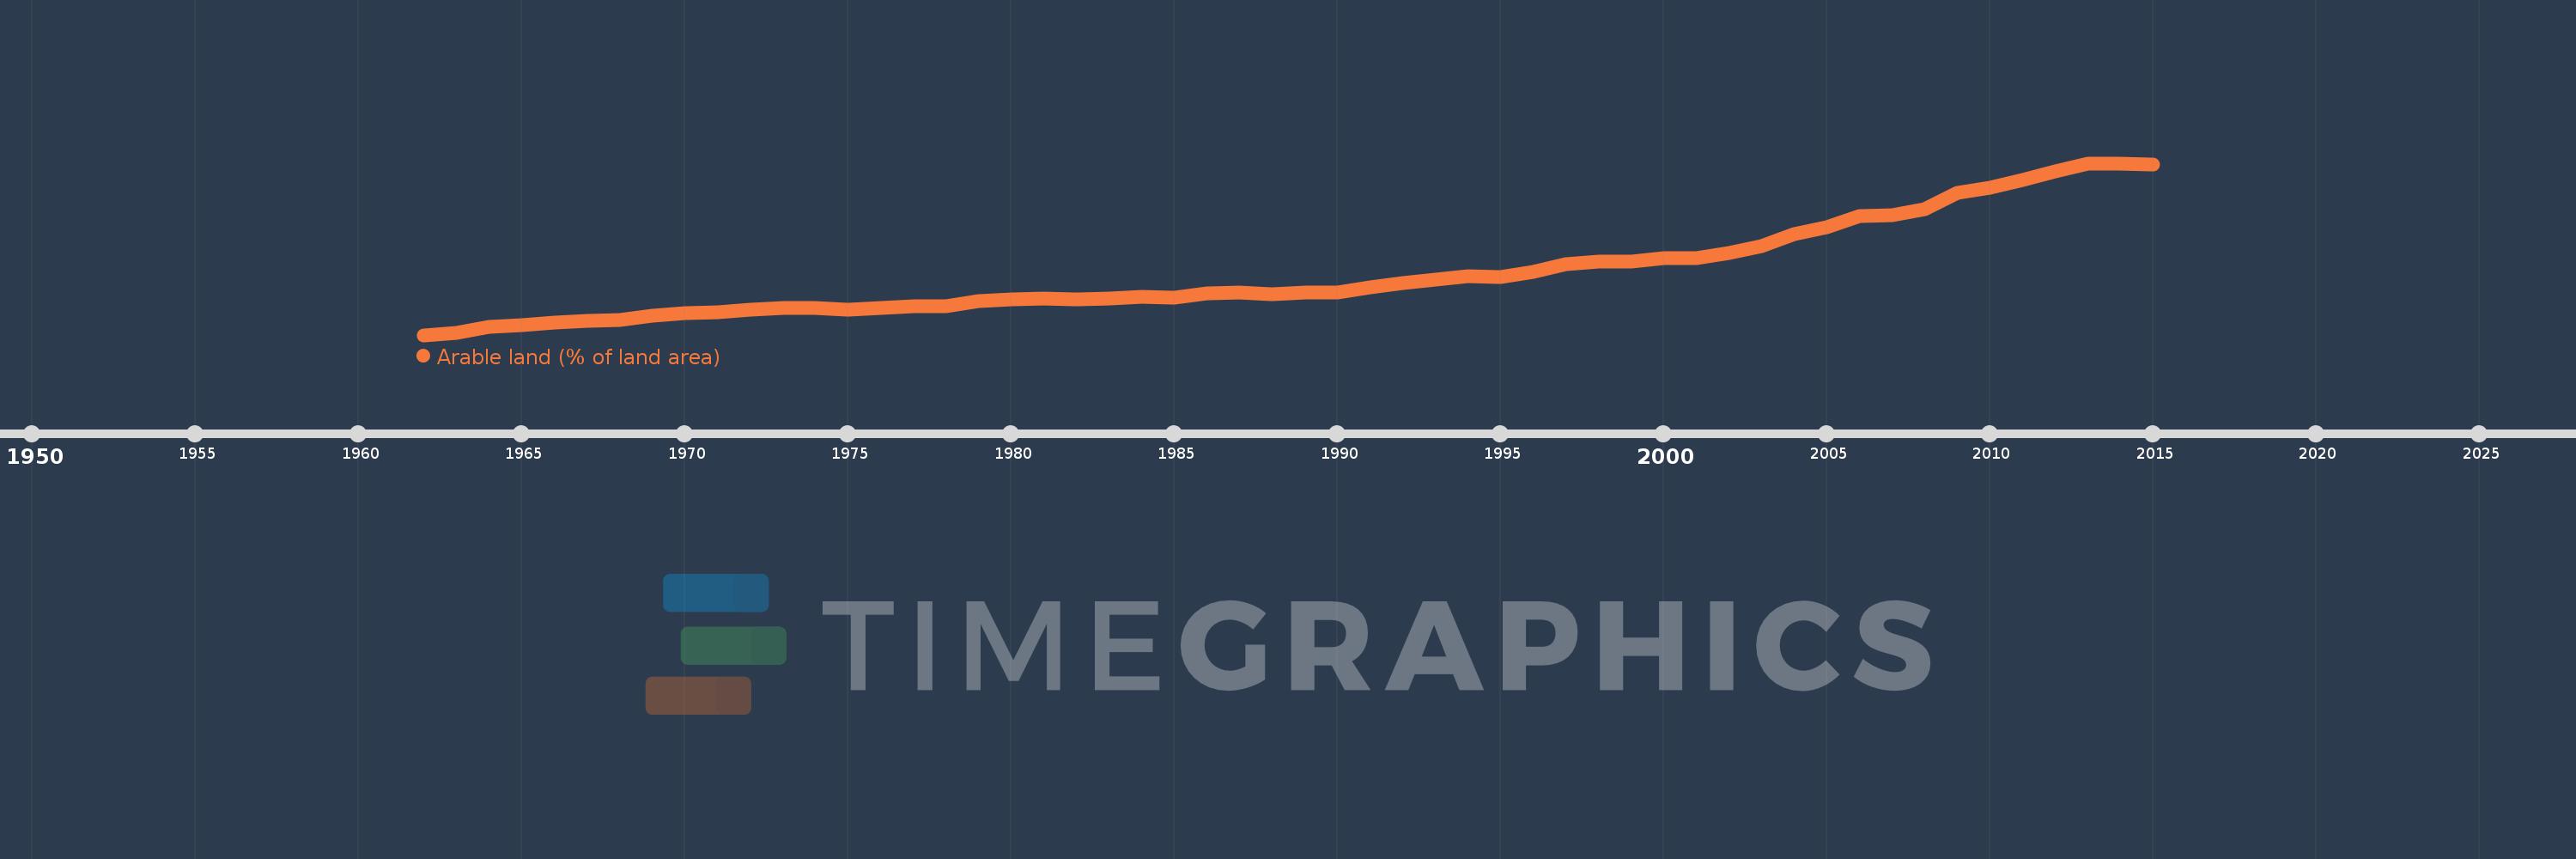
Arable land (% of land area)
2015,2014,2013,2012,2011,2010,2009,2008,2007,2006,2005,2004,2003,2002,2001,2000,1999,1998,1997,1996,1995,1994,1993,1992,1991,1990,1989,1988,1987,1986,1985,1984,1983,1982,1981,1980,1979,1978,1977,1976,1975,1974,1973,1972,1971,1970,1969,1968,1967,1966,1965,1964,1963,1962
This statistics in other country:
AfghanistanAlbaniaAlgeriaAmerican SamoaAndorraAngolaAntigua and BarbudaArab WorldArgentinaArmeniaArubaAustraliaAustriaAzerbaijanBahamas, TheBahrainBangladeshBarbadosBelarusBelgiumBelizeBeninBermudaBhutanBoliviaBosnia and HerzegovinaBotswanaBrazilBritish Virgin IslandsBrunei DarussalamBulgariaBurkina FasoBurundiCabo VerdeCambodiaCameroonCanadaCaribbean small statesCayman IslandsCentral African RepublicCentral Europe and the BalticsChadChannel IslandsChileChinaColombiaComorosCongo, Dem. Rep.Congo, Rep.Costa RicaCote d'IvoireCroatiaCubaCyprusCzech RepublicDenmarkDjiboutiDominicaDominican RepublicEarly-demographic dividendEast Asia & PacificEast Asia & Pacific (excluding high income)East Asia & Pacific (IDA & IBRD countries)EcuadorEgypt, Arab Rep.El SalvadorEquatorial GuineaEritreaEstoniaEthiopiaEuro areaEurope & Central AsiaEurope & Central Asia (excluding high income)Europe & Central Asia (IDA & IBRD countries)European UnionFaroe IslandsFijiFinlandFragile and conflict affected situationsFranceFrench PolynesiaGabonGambia, TheGeorgiaGermanyGhanaGreeceGreenlandGrenadaGuamGuatemalaGuineaGuinea-BissauGuyanaHaitiHeavily indebted poor countries (HIPC)High incomeHondurasHong Kong SAR, ChinaHungaryIBRD onlyIcelandIDA & IBRD totalIDA blendIDA onlyIDA totalIndiaIndonesiaIran, Islamic Rep.IraqIrelandIsle of ManIsraelItalyJamaicaJapanJordanKazakhstanKenyaKiribatiKorea, Dem. People’s Rep.Korea, Rep.KosovoKuwaitKyrgyz RepublicLao PDRLate-demographic dividendLatin America & Caribbean Latin America & Caribbean (excluding high income)Latin America & the Caribbean (IDA & IBRD countries)LatviaLeast developed countries: UN classificationLebanonLesothoLiberiaLibyaLiechtensteinLithuaniaLow & middle incomeLow incomeLower middle incomeLuxembourgMacedonia, FYRMadagascarMalawiMalaysiaMaldivesMaliMaltaMarshall IslandsMauritaniaMauritiusMexicoMicronesia, Fed. Sts.Middle East & North AfricaMiddle East & North Africa (excluding high income)Middle East & North Africa (IDA & IBRD countries)Middle incomeMoldovaMongoliaMontenegroMoroccoMozambiqueMyanmarNamibiaNepalNetherlandsNew CaledoniaNew ZealandNicaraguaNigerNigeriaNorth AmericaNorthern Mariana IslandsNorwayOECD membersOmanOther small statesPacific island small statesPakistanPalauPanamaPapua New GuineaParaguayPeruPhilippinesPolandPortugalPost-demographic dividendPre-demographic dividendPuerto RicoQatarRomaniaRussian FederationRwandaSamoaSan MarinoSao Tome and PrincipeSaudi ArabiaSenegalSerbiaSeychellesSierra LeoneSingaporeSlovak RepublicSloveniaSmall statesSolomon IslandsSomaliaSouth AfricaSouth AsiaSouth Asia (IDA & IBRD)SpainSri LankaSt. Kitts and NevisSt. LuciaSt. Vincent and the GrenadinesSub-Saharan Africa Sub-Saharan Africa (excluding high income)Sub-Saharan Africa (IDA & IBRD countries)SudanSurinameSwazilandSwedenSwitzerlandSyrian Arab RepublicTajikistanTanzaniaThailandTimor-LesteTogoTongaTrinidad and TobagoTunisiaTurkeyTurkmenistanTurks and Caicos IslandsUgandaUkraineUnited Arab EmiratesUnited KingdomUnited StatesUpper middle incomeUruguayUzbekistanVanuatuVenezuela, RBVietnamVirgin Islands (U.S.)West Bank and GazaWorldYemen, Rep.ZambiaZimbabwe Timeline:
This timeline shows a graph from 1962 to 2015 of Low income. No data until 1961. Number of actual observations by date: 54.
Source name:
World Development Indicators
Source organization:
Food and Agriculture Organization, electronic files and web site.
Categories, topics:
Agriculture & Rural Development, Climate Change, Environment
Last updated:
apr 23, 2017
Indicators value changes by year
At the date of observation
Value
Absolute change
Change from previous value
jan 1, 1962
5.831
+5.831
0.0%
jan 1, 1963
5.88
+0.05
0.85%
jan 1, 1964
6.002
+0.122
2.07%
jan 1, 1965
6.048
+0.045
0.75%
jan 1, 1966
6.102
+0.055
0.9%
jan 1, 1967
6.124
+0.022
0.36%
jan 1, 1968
6.151
+0.026
0.43%
jan 1, 1969
6.248
+0.097
1.58%
jan 1, 1970
6.293
+0.046
0.73%
jan 1, 1971
6.313
+0.02
0.31%
jan 1, 1972
6.366
+0.052
0.83%
jan 1, 1973
6.402
+0.037
0.58%
jan 1, 1974
6.414
+0.012
0.18%
jan 1, 1975
6.373
-0.042
-0.65%
jan 1, 1976
6.408
+0.036
0.56%
jan 1, 1977
6.444
+0.036
0.56%
jan 1, 1978
6.45
+0.006
0.09%
jan 1, 1979
6.559
+0.109
1.69%
jan 1, 1980
6.585
+0.026
0.39%
jan 1, 1981
6.604
+0.019
0.3%
jan 1, 1982
6.586
-0.018
-0.27%
jan 1, 1983
6.607
+0.021
0.31%
jan 1, 1984
6.638
+0.031
0.47%
jan 1, 1985
6.631
-0.007
-0.11%
jan 1, 1986
6.719
+0.088
1.33%
jan 1, 1987
6.732
+0.013
0.2%
jan 1, 1988
6.705
-0.027
-0.4%
jan 1, 1989
6.735
+0.03
0.44%
jan 1, 1990
6.741
+0.007
0.1%
jan 1, 1991
6.85
+0.109
1.62%
jan 1, 1992
6.935
+0.084
1.23%
jan 1, 1993
7.002
+0.068
0.97%
jan 1, 1994
7.081
+0.078
1.12%
jan 1, 1995
7.071
-0.01
-0.14%
jan 1, 1996
7.179
+0.108
1.53%
jan 1, 1997
7.331
+0.152
2.12%
jan 1, 1998
7.385
+0.054
0.74%
jan 1, 1999
7.401
+0.016
0.21%
jan 1, 2000
7.473
+0.072
0.97%
jan 1, 2001
7.474
+0.001
0.02%
jan 1, 2002
7.578
+0.104
1.39%
jan 1, 2003
7.714
+0.136
1.79%
jan 1, 2004
7.983
+0.269
3.48%
jan 1, 2005
8.128
+0.146
1.82%
jan 1, 2006
8.361
+0.233
2.87%
jan 1, 2007
8.379
+0.018
0.21%
jan 1, 2008
8.513
+0.134
1.6%
jan 1, 2009
8.854
+0.341
4.0%
jan 1, 2010
8.972
+0.118
1.34%
jan 1, 2011
9.127
+0.155
1.73%
jan 1, 2012
9.308
+0.181
1.98%
jan 1, 2013
9.485
+0.178
1.91%
jan 1, 2014
9.476
-0.009
-0.1%
jan 1, 2015
9.458
-0.018
-0.19%
Ranking of countries by current statistics by years


Comments: