29
/
en
AIzaSyAYiBZKx7MnpbEhh9jyipgxe19OcubqV5w
April 1, 2024
230680
Rwanda
RWA
true
2
1
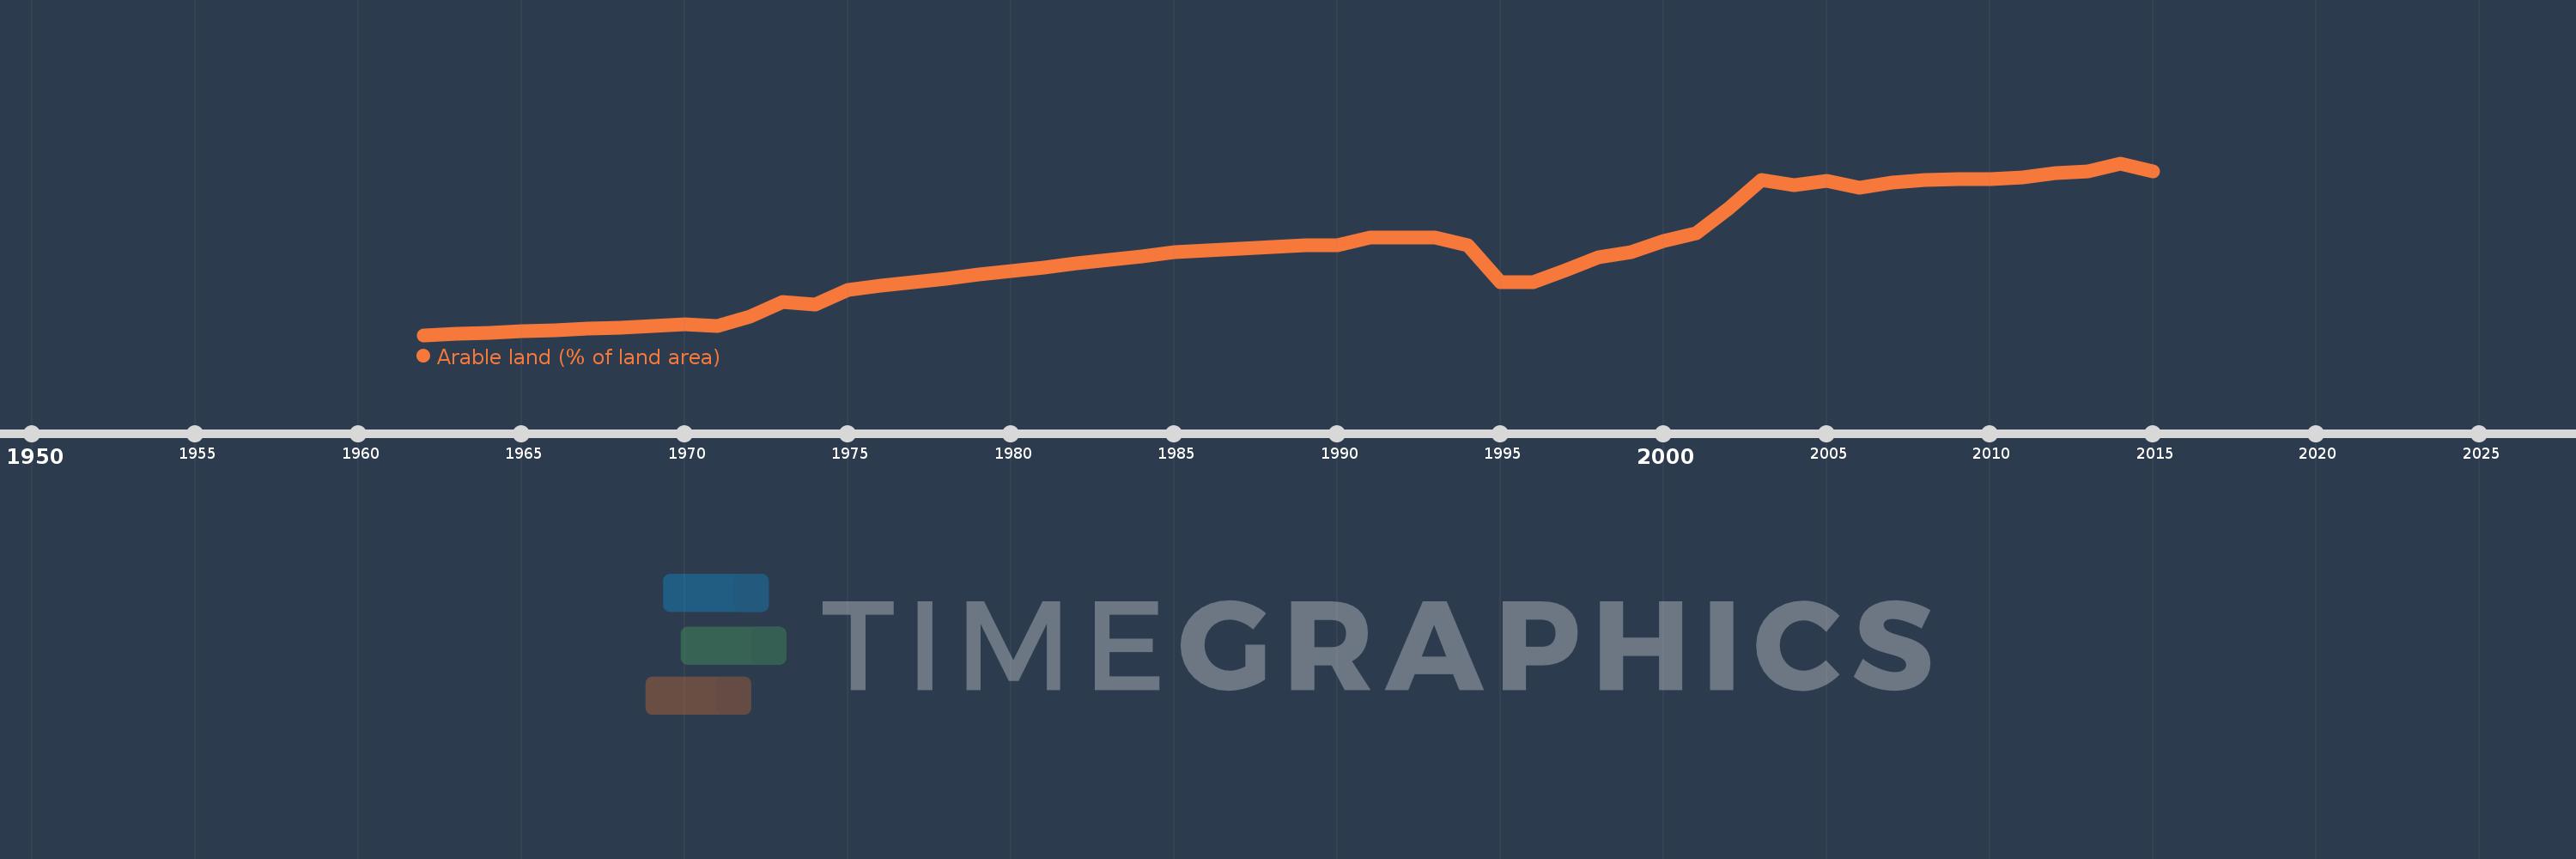
Arable land (% of land area)
2015,2014,2013,2012,2011,2010,2009,2008,2007,2006,2005,2004,2003,2002,2001,2000,1999,1998,1997,1996,1995,1994,1993,1992,1991,1990,1989,1988,1987,1986,1985,1984,1983,1982,1981,1980,1979,1978,1977,1976,1975,1974,1973,1972,1971,1970,1969,1968,1967,1966,1965,1964,1963,1962
This statistics in other country:
AfghanistanAlbaniaAlgeriaAmerican SamoaAndorraAngolaAntigua and BarbudaArab WorldArgentinaArmeniaArubaAustraliaAustriaAzerbaijanBahamas, TheBahrainBangladeshBarbadosBelarusBelgiumBelizeBeninBermudaBhutanBoliviaBosnia and HerzegovinaBotswanaBrazilBritish Virgin IslandsBrunei DarussalamBulgariaBurkina FasoBurundiCabo VerdeCambodiaCameroonCanadaCaribbean small statesCayman IslandsCentral African RepublicCentral Europe and the BalticsChadChannel IslandsChileChinaColombiaComorosCongo, Dem. Rep.Congo, Rep.Costa RicaCote d'IvoireCroatiaCubaCyprusCzech RepublicDenmarkDjiboutiDominicaDominican RepublicEarly-demographic dividendEast Asia & PacificEast Asia & Pacific (excluding high income)East Asia & Pacific (IDA & IBRD countries)EcuadorEgypt, Arab Rep.El SalvadorEquatorial GuineaEritreaEstoniaEthiopiaEuro areaEurope & Central AsiaEurope & Central Asia (excluding high income)Europe & Central Asia (IDA & IBRD countries)European UnionFaroe IslandsFijiFinlandFragile and conflict affected situationsFranceFrench PolynesiaGabonGambia, TheGeorgiaGermanyGhanaGreeceGreenlandGrenadaGuamGuatemalaGuineaGuinea-BissauGuyanaHaitiHeavily indebted poor countries (HIPC)High incomeHondurasHong Kong SAR, ChinaHungaryIBRD onlyIcelandIDA & IBRD totalIDA blendIDA onlyIDA totalIndiaIndonesiaIran, Islamic Rep.IraqIrelandIsle of ManIsraelItalyJamaicaJapanJordanKazakhstanKenyaKiribatiKorea, Dem. People’s Rep.Korea, Rep.KosovoKuwaitKyrgyz RepublicLao PDRLate-demographic dividendLatin America & Caribbean Latin America & Caribbean (excluding high income)Latin America & the Caribbean (IDA & IBRD countries)LatviaLeast developed countries: UN classificationLebanonLesothoLiberiaLibyaLiechtensteinLithuaniaLow & middle incomeLow incomeLower middle incomeLuxembourgMacedonia, FYRMadagascarMalawiMalaysiaMaldivesMaliMaltaMarshall IslandsMauritaniaMauritiusMexicoMicronesia, Fed. Sts.Middle East & North AfricaMiddle East & North Africa (excluding high income)Middle East & North Africa (IDA & IBRD countries)Middle incomeMoldovaMongoliaMontenegroMoroccoMozambiqueMyanmarNamibiaNepalNetherlandsNew CaledoniaNew ZealandNicaraguaNigerNigeriaNorth AmericaNorthern Mariana IslandsNorwayOECD membersOmanOther small statesPacific island small statesPakistanPalauPanamaPapua New GuineaParaguayPeruPhilippinesPolandPortugalPost-demographic dividendPre-demographic dividendPuerto RicoQatarRomaniaRussian FederationRwandaSamoaSan MarinoSao Tome and PrincipeSaudi ArabiaSenegalSerbiaSeychellesSierra LeoneSingaporeSlovak RepublicSloveniaSmall statesSolomon IslandsSomaliaSouth AfricaSouth AsiaSouth Asia (IDA & IBRD)SpainSri LankaSt. Kitts and NevisSt. LuciaSt. Vincent and the GrenadinesSub-Saharan Africa Sub-Saharan Africa (excluding high income)Sub-Saharan Africa (IDA & IBRD countries)SudanSurinameSwazilandSwedenSwitzerlandSyrian Arab RepublicTajikistanTanzaniaThailandTimor-LesteTogoTongaTrinidad and TobagoTunisiaTurkeyTurkmenistanTurks and Caicos IslandsUgandaUkraineUnited Arab EmiratesUnited KingdomUnited StatesUpper middle incomeUruguayUzbekistanVanuatuVenezuela, RBVietnamVirgin Islands (U.S.)West Bank and GazaWorldYemen, Rep.ZambiaZimbabwe Timeline:
This timeline shows a graph from 1962 to 2015 of Rwanda. No data until 1961. Number of actual observations by date: 54.
Source name:
World Development Indicators
Source organization:
Food and Agriculture Organization, electronic files and web site.
Categories, topics:
Agriculture & Rural Development, Climate Change, Environment
Last updated:
apr 23, 2017
Indicators value changes by year
Maximum:
47.933
jan 1, 2014
At the date of observation
Value
Absolute change
Change from previous value
jan 1, 1962
19.66
+19.66
0.0%
jan 1, 1963
19.862
+0.203
1.03%
jan 1, 1964
20.065
+0.203
1.02%
jan 1, 1965
20.268
+0.203
1.01%
jan 1, 1966
20.47
+0.203
1.0%
jan 1, 1967
20.673
+0.203
0.99%
jan 1, 1968
20.876
+0.203
0.98%
jan 1, 1969
21.119
+0.243
1.17%
jan 1, 1970
21.403
+0.284
1.34%
jan 1, 1971
21.159
-0.243
-1.14%
jan 1, 1972
22.7
+1.54
7.28%
jan 1, 1973
25.172
+2.473
10.89%
jan 1, 1974
24.726
-0.446
-1.77%
jan 1, 1975
27.077
+2.351
9.51%
jan 1, 1976
27.807
+0.73
2.69%
jan 1, 1977
28.375
+0.567
2.04%
jan 1, 1978
28.983
+0.608
2.14%
jan 1, 1979
29.591
+0.608
2.1%
jan 1, 1980
30.199
+0.608
2.05%
jan 1, 1981
30.807
+0.608
2.01%
jan 1, 1982
31.415
+0.608
1.97%
jan 1, 1983
32.023
+0.608
1.94%
jan 1, 1984
32.631
+0.608
1.9%
jan 1, 1985
33.239
+0.608
1.86%
jan 1, 1986
33.522
+0.284
0.85%
jan 1, 1987
33.806
+0.284
0.85%
jan 1, 1988
34.131
+0.324
0.96%
jan 1, 1989
34.414
+0.284
0.83%
jan 1, 1990
34.455
+0.041
0.12%
jan 1, 1991
35.671
+1.216
3.53%
jan 1, 1992
35.671
0.0
0.0%
jan 1, 1993
35.671
0.0
0.0%
jan 1, 1994
34.455
-1.216
-3.41%
jan 1, 1995
28.375
-6.08
-17.65%
jan 1, 1996
28.375
0.0
0.0%
jan 1, 1997
30.401
+2.027
7.14%
jan 1, 1998
32.428
+2.027
6.67%
jan 1, 1999
33.239
+0.811
2.5%
jan 1, 2000
35.103
+1.865
5.61%
jan 1, 2001
36.482
+1.378
3.93%
jan 1, 2002
40.535
+4.054
11.11%
jan 1, 2003
45.237
+4.702
11.6%
jan 1, 2004
44.345
-0.892
-1.97%
jan 1, 2005
45.03
+0.684
1.54%
jan 1, 2006
43.895
-1.134
-2.52%
jan 1, 2007
44.708
+0.813
1.85%
jan 1, 2008
45.192
+0.484
1.08%
jan 1, 2009
45.296
+0.104
0.23%
jan 1, 2010
45.353
+0.058
0.13%
jan 1, 2011
45.558
+0.205
0.45%
jan 1, 2012
46.268
+0.71
1.56%
jan 1, 2013
46.645
+0.377
0.81%
jan 1, 2014
47.933
+1.288
2.76%
jan 1, 2015
46.595
-1.338
-2.79%
Ranking of countries by current statistics by years


Comments: