29
/
en
AIzaSyAYiBZKx7MnpbEhh9jyipgxe19OcubqV5w
April 1, 2024
209075
New Zealand
NZL
true
2
1
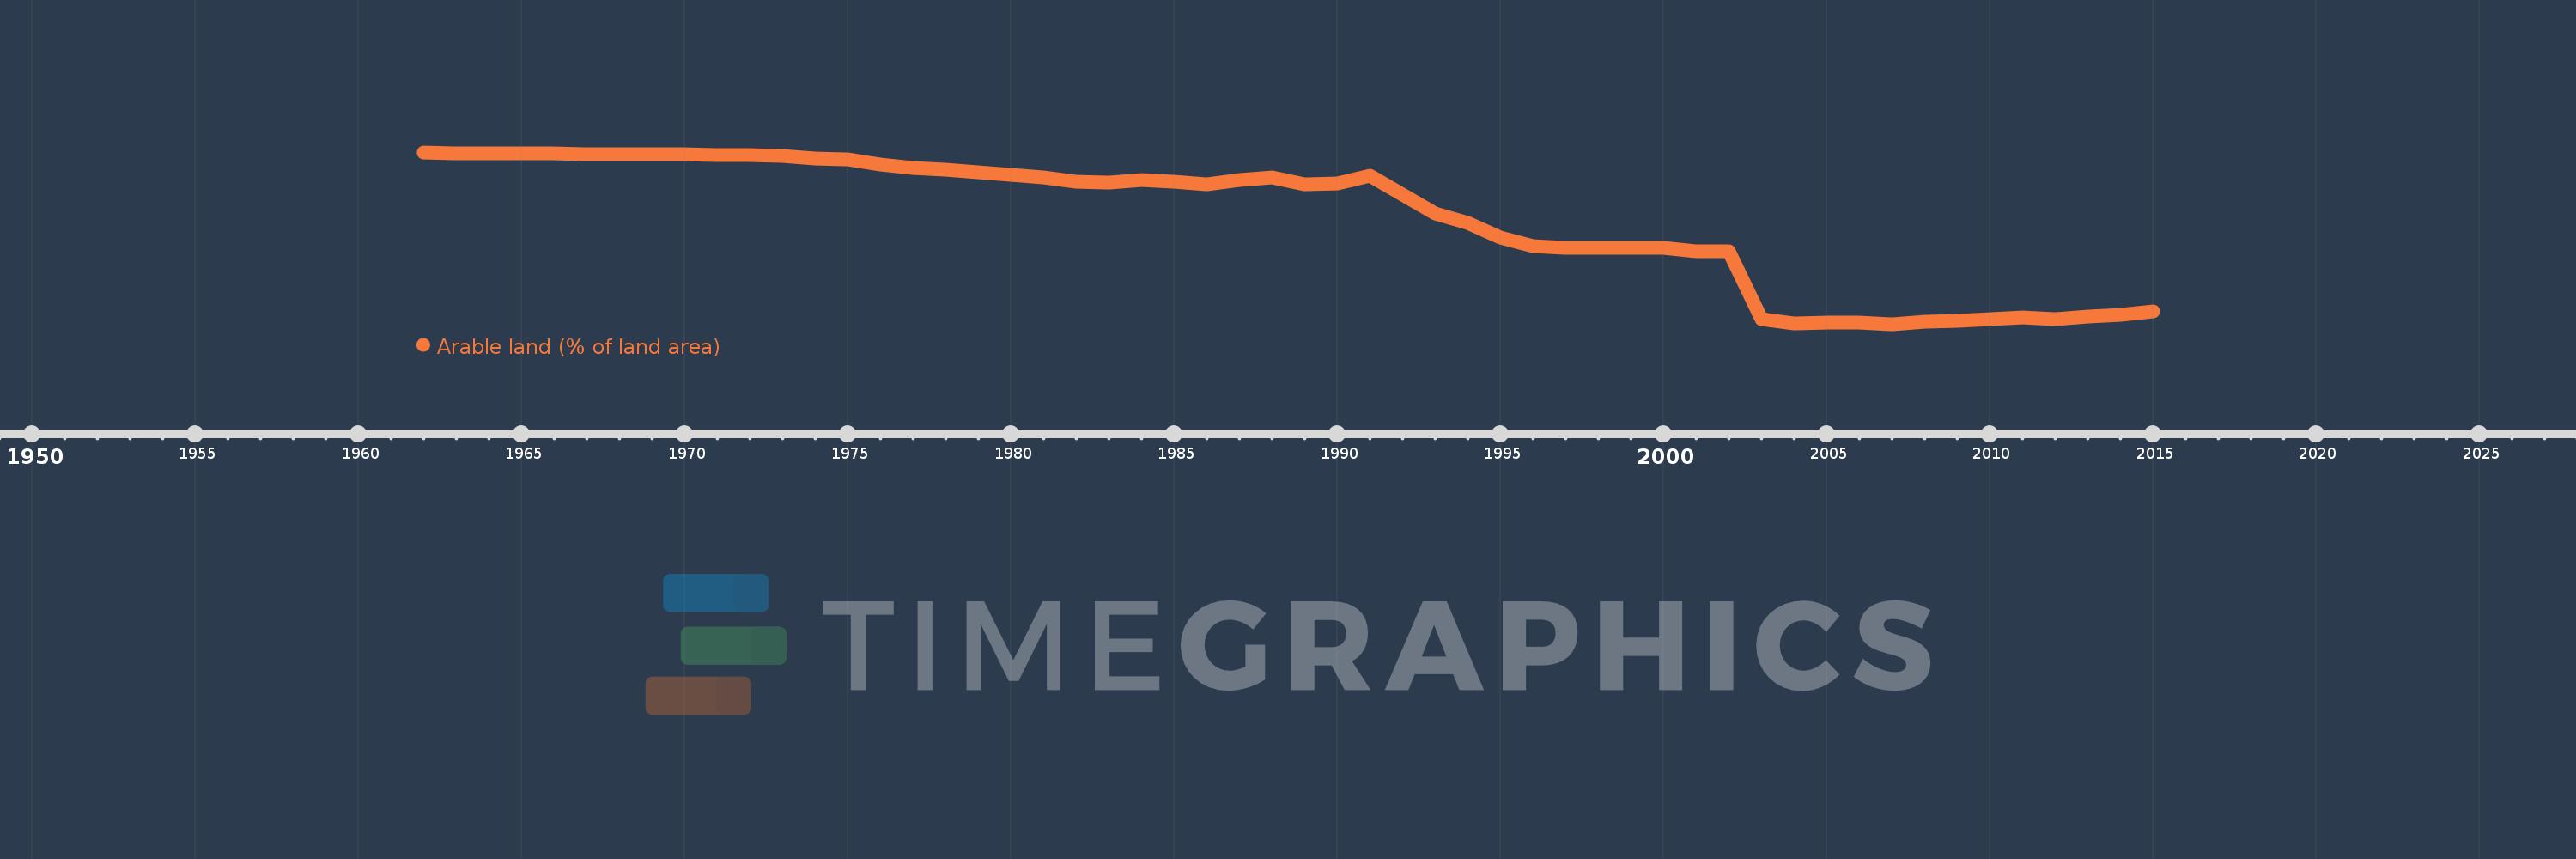
Arable land (% of land area)
2015,2014,2013,2012,2011,2010,2009,2008,2007,2006,2005,2004,2003,2002,2001,2000,1999,1998,1997,1996,1995,1994,1993,1992,1991,1990,1989,1988,1987,1986,1985,1984,1983,1982,1981,1980,1979,1978,1977,1976,1975,1974,1973,1972,1971,1970,1969,1968,1967,1966,1965,1964,1963,1962
This statistics in other country:
AfghanistanAlbaniaAlgeriaAmerican SamoaAndorraAngolaAntigua and BarbudaArab WorldArgentinaArmeniaArubaAustraliaAustriaAzerbaijanBahamas, TheBahrainBangladeshBarbadosBelarusBelgiumBelizeBeninBermudaBhutanBoliviaBosnia and HerzegovinaBotswanaBrazilBritish Virgin IslandsBrunei DarussalamBulgariaBurkina FasoBurundiCabo VerdeCambodiaCameroonCanadaCaribbean small statesCayman IslandsCentral African RepublicCentral Europe and the BalticsChadChannel IslandsChileChinaColombiaComorosCongo, Dem. Rep.Congo, Rep.Costa RicaCote d'IvoireCroatiaCubaCyprusCzech RepublicDenmarkDjiboutiDominicaDominican RepublicEarly-demographic dividendEast Asia & PacificEast Asia & Pacific (excluding high income)East Asia & Pacific (IDA & IBRD countries)EcuadorEgypt, Arab Rep.El SalvadorEquatorial GuineaEritreaEstoniaEthiopiaEuro areaEurope & Central AsiaEurope & Central Asia (excluding high income)Europe & Central Asia (IDA & IBRD countries)European UnionFaroe IslandsFijiFinlandFragile and conflict affected situationsFranceFrench PolynesiaGabonGambia, TheGeorgiaGermanyGhanaGreeceGreenlandGrenadaGuamGuatemalaGuineaGuinea-BissauGuyanaHaitiHeavily indebted poor countries (HIPC)High incomeHondurasHong Kong SAR, ChinaHungaryIBRD onlyIcelandIDA & IBRD totalIDA blendIDA onlyIDA totalIndiaIndonesiaIran, Islamic Rep.IraqIrelandIsle of ManIsraelItalyJamaicaJapanJordanKazakhstanKenyaKiribatiKorea, Dem. People’s Rep.Korea, Rep.KosovoKuwaitKyrgyz RepublicLao PDRLate-demographic dividendLatin America & Caribbean Latin America & Caribbean (excluding high income)Latin America & the Caribbean (IDA & IBRD countries)LatviaLeast developed countries: UN classificationLebanonLesothoLiberiaLibyaLiechtensteinLithuaniaLow & middle incomeLow incomeLower middle incomeLuxembourgMacedonia, FYRMadagascarMalawiMalaysiaMaldivesMaliMaltaMarshall IslandsMauritaniaMauritiusMexicoMicronesia, Fed. Sts.Middle East & North AfricaMiddle East & North Africa (excluding high income)Middle East & North Africa (IDA & IBRD countries)Middle incomeMoldovaMongoliaMontenegroMoroccoMozambiqueMyanmarNamibiaNepalNetherlandsNew CaledoniaNew ZealandNicaraguaNigerNigeriaNorth AmericaNorthern Mariana IslandsNorwayOECD membersOmanOther small statesPacific island small statesPakistanPalauPanamaPapua New GuineaParaguayPeruPhilippinesPolandPortugalPost-demographic dividendPre-demographic dividendPuerto RicoQatarRomaniaRussian FederationRwandaSamoaSan MarinoSao Tome and PrincipeSaudi ArabiaSenegalSerbiaSeychellesSierra LeoneSingaporeSlovak RepublicSloveniaSmall statesSolomon IslandsSomaliaSouth AfricaSouth AsiaSouth Asia (IDA & IBRD)SpainSri LankaSt. Kitts and NevisSt. LuciaSt. Vincent and the GrenadinesSub-Saharan Africa Sub-Saharan Africa (excluding high income)Sub-Saharan Africa (IDA & IBRD countries)SudanSurinameSwazilandSwedenSwitzerlandSyrian Arab RepublicTajikistanTanzaniaThailandTimor-LesteTogoTongaTrinidad and TobagoTunisiaTurkeyTurkmenistanTurks and Caicos IslandsUgandaUkraineUnited Arab EmiratesUnited KingdomUnited StatesUpper middle incomeUruguayUzbekistanVanuatuVenezuela, RBVietnamVirgin Islands (U.S.)West Bank and GazaWorldYemen, Rep.ZambiaZimbabwe Timeline:
This timeline shows a graph from 1962 to 2015 of New Zealand. No data until 1961. Number of actual observations by date: 54.
Source name:
World Development Indicators
Source organization:
Food and Agriculture Organization, electronic files and web site.
Categories, topics:
Agriculture & Rural Development, Climate Change, Environment
Last updated:
apr 23, 2017
Indicators value changes by year
Maximum:
11.393
jan 1, 1962
At the date of observation
Value
Absolute change
Change from previous value
jan 1, 1962
11.393
+11.393
0.0%
jan 1, 1963
11.355
-0.038
-0.33%
jan 1, 1964
11.336
-0.019
-0.17%
jan 1, 1965
11.317
-0.019
-0.17%
jan 1, 1966
11.317
0.0
0.0%
jan 1, 1967
11.298
-0.019
-0.17%
jan 1, 1968
11.298
0.0
0.0%
jan 1, 1969
11.279
-0.019
-0.17%
jan 1, 1970
11.279
0.0
0.0%
jan 1, 1971
11.26
-0.019
-0.17%
jan 1, 1972
11.242
-0.019
-0.17%
jan 1, 1973
11.207
-0.034
-0.3%
jan 1, 1974
11.059
-0.148
-1.32%
jan 1, 1975
10.972
-0.087
-0.79%
jan 1, 1976
10.706
-0.266
-2.42%
jan 1, 1977
10.486
-0.22
-2.06%
jan 1, 1978
10.391
-0.095
-0.91%
jan 1, 1979
10.262
-0.129
-1.24%
jan 1, 1980
10.106
-0.156
-1.52%
jan 1, 1981
9.935
-0.171
-1.69%
jan 1, 1982
9.722
-0.213
-2.14%
jan 1, 1983
9.673
-0.049
-0.51%
jan 1, 1984
9.817
+0.144
1.49%
jan 1, 1985
9.73
-0.087
-0.89%
jan 1, 1986
9.578
-0.152
-1.56%
jan 1, 1987
9.817
+0.239
2.5%
jan 1, 1988
9.935
+0.118
1.2%
jan 1, 1989
9.567
-0.368
-3.71%
jan 1, 1990
9.624
+0.057
0.6%
jan 1, 1991
10.045
+0.422
4.38%
jan 1, 1992
8.948
-1.098
-10.93%
jan 1, 1993
7.88
-1.067
-11.93%
jan 1, 1994
7.33
-0.551
-6.99%
jan 1, 1995
6.483
-0.847
-11.55%
jan 1, 1996
5.997
-0.486
-7.5%
jan 1, 1997
5.917
-0.08
-1.33%
jan 1, 1998
5.906
-0.011
-0.19%
jan 1, 1999
5.906
0.0
0.0%
jan 1, 2000
5.906
0.0
0.0%
jan 1, 2001
5.697
-0.209
-3.54%
jan 1, 2002
5.697
0.0
0.0%
jan 1, 2003
1.808
-3.889
-68.27%
jan 1, 2004
1.576
-0.232
-12.82%
jan 1, 2005
1.595
+0.019
1.2%
jan 1, 2006
1.614
+0.019
1.19%
jan 1, 2007
1.515
-0.099
-6.12%
jan 1, 2008
1.637
+0.122
8.02%
jan 1, 2009
1.72
+0.084
5.1%
jan 1, 2010
1.789
+0.068
3.97%
jan 1, 2011
1.895
+0.106
5.94%
jan 1, 2012
1.789
-0.106
-5.61%
jan 1, 2013
1.933
+0.144
8.07%
jan 1, 2014
2.077
+0.144
7.47%
jan 1, 2015
2.241
+0.163
7.86%
Ranking of countries by current statistics by years


Comments: