29
/
en
AIzaSyAYiBZKx7MnpbEhh9jyipgxe19OcubqV5w
April 1, 2024
37954
IDA blend
IDB
false
2
1
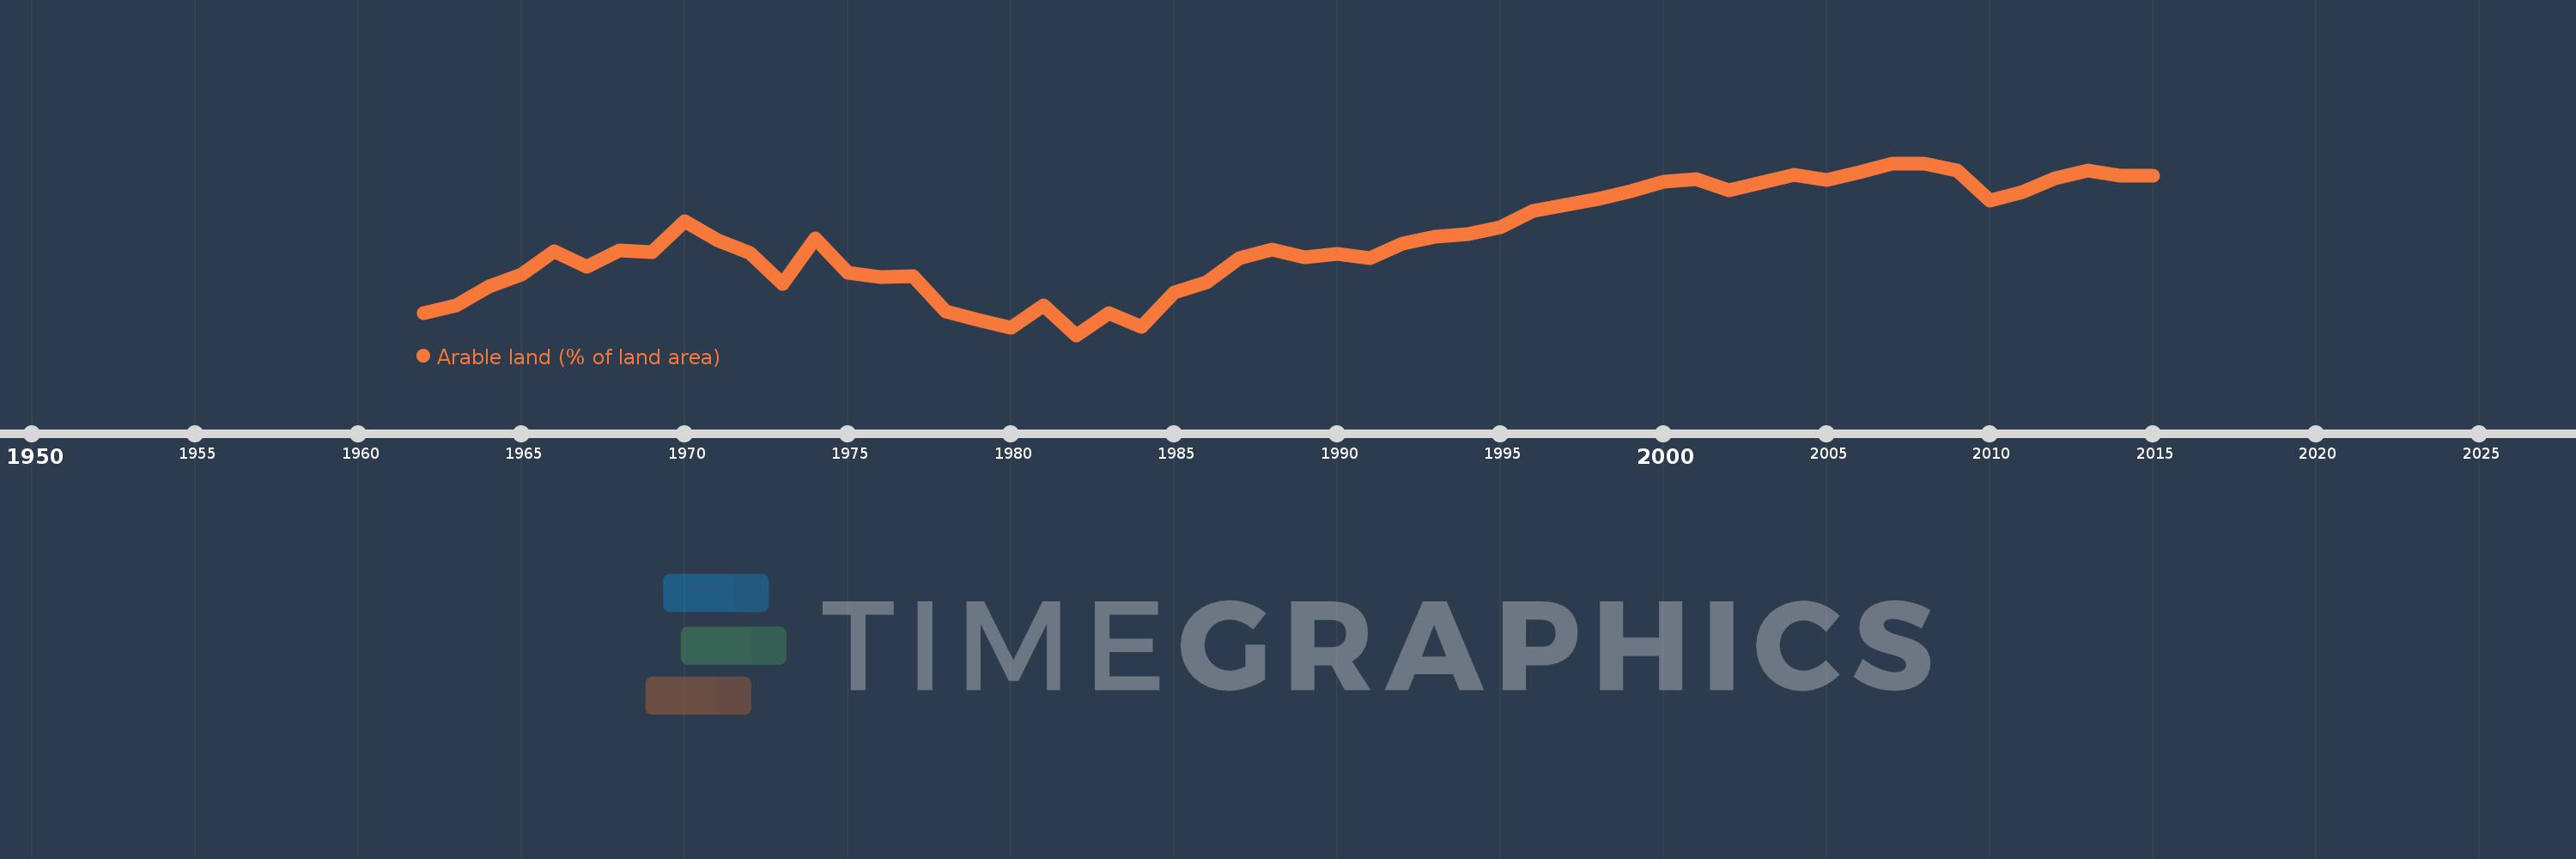
Arable land (% of land area)
2015,2014,2013,2012,2011,2010,2009,2008,2007,2006,2005,2004,2003,2002,2001,2000,1999,1998,1997,1996,1995,1994,1993,1992,1991,1990,1989,1988,1987,1986,1985,1984,1983,1982,1981,1980,1979,1978,1977,1976,1975,1974,1973,1972,1971,1970,1969,1968,1967,1966,1965,1964,1963,1962
This statistics in other country:
AfghanistanAlbaniaAlgeriaAmerican SamoaAndorraAngolaAntigua and BarbudaArab WorldArgentinaArmeniaArubaAustraliaAustriaAzerbaijanBahamas, TheBahrainBangladeshBarbadosBelarusBelgiumBelizeBeninBermudaBhutanBoliviaBosnia and HerzegovinaBotswanaBrazilBritish Virgin IslandsBrunei DarussalamBulgariaBurkina FasoBurundiCabo VerdeCambodiaCameroonCanadaCaribbean small statesCayman IslandsCentral African RepublicCentral Europe and the BalticsChadChannel IslandsChileChinaColombiaComorosCongo, Dem. Rep.Congo, Rep.Costa RicaCote d'IvoireCroatiaCubaCyprusCzech RepublicDenmarkDjiboutiDominicaDominican RepublicEarly-demographic dividendEast Asia & PacificEast Asia & Pacific (excluding high income)East Asia & Pacific (IDA & IBRD countries)EcuadorEgypt, Arab Rep.El SalvadorEquatorial GuineaEritreaEstoniaEthiopiaEuro areaEurope & Central AsiaEurope & Central Asia (excluding high income)Europe & Central Asia (IDA & IBRD countries)European UnionFaroe IslandsFijiFinlandFragile and conflict affected situationsFranceFrench PolynesiaGabonGambia, TheGeorgiaGermanyGhanaGreeceGreenlandGrenadaGuamGuatemalaGuineaGuinea-BissauGuyanaHaitiHeavily indebted poor countries (HIPC)High incomeHondurasHong Kong SAR, ChinaHungaryIBRD onlyIcelandIDA & IBRD totalIDA blendIDA onlyIDA totalIndiaIndonesiaIran, Islamic Rep.IraqIrelandIsle of ManIsraelItalyJamaicaJapanJordanKazakhstanKenyaKiribatiKorea, Dem. People’s Rep.Korea, Rep.KosovoKuwaitKyrgyz RepublicLao PDRLate-demographic dividendLatin America & Caribbean Latin America & Caribbean (excluding high income)Latin America & the Caribbean (IDA & IBRD countries)LatviaLeast developed countries: UN classificationLebanonLesothoLiberiaLibyaLiechtensteinLithuaniaLow & middle incomeLow incomeLower middle incomeLuxembourgMacedonia, FYRMadagascarMalawiMalaysiaMaldivesMaliMaltaMarshall IslandsMauritaniaMauritiusMexicoMicronesia, Fed. Sts.Middle East & North AfricaMiddle East & North Africa (excluding high income)Middle East & North Africa (IDA & IBRD countries)Middle incomeMoldovaMongoliaMontenegroMoroccoMozambiqueMyanmarNamibiaNepalNetherlandsNew CaledoniaNew ZealandNicaraguaNigerNigeriaNorth AmericaNorthern Mariana IslandsNorwayOECD membersOmanOther small statesPacific island small statesPakistanPalauPanamaPapua New GuineaParaguayPeruPhilippinesPolandPortugalPost-demographic dividendPre-demographic dividendPuerto RicoQatarRomaniaRussian FederationRwandaSamoaSan MarinoSao Tome and PrincipeSaudi ArabiaSenegalSerbiaSeychellesSierra LeoneSingaporeSlovak RepublicSloveniaSmall statesSolomon IslandsSomaliaSouth AfricaSouth AsiaSouth Asia (IDA & IBRD)SpainSri LankaSt. Kitts and NevisSt. LuciaSt. Vincent and the GrenadinesSub-Saharan Africa Sub-Saharan Africa (excluding high income)Sub-Saharan Africa (IDA & IBRD countries)SudanSurinameSwazilandSwedenSwitzerlandSyrian Arab RepublicTajikistanTanzaniaThailandTimor-LesteTogoTongaTrinidad and TobagoTunisiaTurkeyTurkmenistanTurks and Caicos IslandsUgandaUkraineUnited Arab EmiratesUnited KingdomUnited StatesUpper middle incomeUruguayUzbekistanVanuatuVenezuela, RBVietnamVirgin Islands (U.S.)West Bank and GazaWorldYemen, Rep.ZambiaZimbabwe Timeline:
This timeline shows a graph from 1962 to 2015 of IDA blend. No data until 1961. Number of actual observations by date: 54.
Source name:
World Development Indicators
Source organization:
Food and Agriculture Organization, electronic files and web site.
Categories, topics:
Agriculture & Rural Development, Climate Change, Environment
Last updated:
apr 23, 2017
Indicators value changes by year
Minimum:
10.484
jan 1, 1982
Maximum:
14.135
jan 1, 2008
At the date of observation
Value
Absolute change
Change from previous value
jan 1, 1962
10.958
+10.958
0.0%
jan 1, 1963
11.118
+0.16
1.46%
jan 1, 1964
11.507
+0.389
3.5%
jan 1, 1965
11.77
+0.263
2.29%
jan 1, 1966
12.258
+0.488
4.14%
jan 1, 1967
11.928
-0.33
-2.69%
jan 1, 1968
12.281
+0.353
2.96%
jan 1, 1969
12.247
-0.034
-0.28%
jan 1, 1970
12.906
+0.659
5.38%
jan 1, 1971
12.508
-0.397
-3.08%
jan 1, 1972
12.232
-0.276
-2.21%
jan 1, 1973
11.574
-0.658
-5.38%
jan 1, 1974
12.534
+0.96
8.3%
jan 1, 1975
11.805
-0.729
-5.81%
jan 1, 1976
11.713
-0.093
-0.78%
jan 1, 1977
11.737
+0.024
0.2%
jan 1, 1978
10.981
-0.755
-6.44%
jan 1, 1979
10.802
-0.179
-1.63%
jan 1, 1980
10.636
-0.166
-1.54%
jan 1, 1981
11.111
+0.475
4.46%
jan 1, 1982
10.484
-0.627
-5.64%
jan 1, 1983
10.956
+0.473
4.51%
jan 1, 1984
10.658
-0.298
-2.72%
jan 1, 1985
11.386
+0.728
6.83%
jan 1, 1986
11.609
+0.223
1.96%
jan 1, 1987
12.123
+0.514
4.42%
jan 1, 1988
12.303
+0.181
1.49%
jan 1, 1989
12.136
-0.167
-1.36%
jan 1, 1990
12.21
+0.074
0.61%
jan 1, 1991
12.116
-0.094
-0.77%
jan 1, 1992
12.427
+0.311
2.57%
jan 1, 1993
12.566
+0.139
1.12%
jan 1, 1994
12.623
+0.057
0.45%
jan 1, 1995
12.779
+0.156
1.23%
jan 1, 1996
13.12
+0.341
2.67%
jan 1, 1997
13.243
+0.123
0.93%
jan 1, 1998
13.375
+0.133
1.0%
jan 1, 1999
13.537
+0.162
1.21%
jan 1, 2000
13.735
+0.198
1.46%
jan 1, 2001
13.802
+0.067
0.49%
jan 1, 2002
13.562
-0.241
-1.74%
jan 1, 2003
13.724
+0.162
1.2%
jan 1, 2004
13.894
+0.17
1.24%
jan 1, 2005
13.776
-0.118
-0.85%
jan 1, 2006
13.948
+0.172
1.25%
jan 1, 2007
14.122
+0.174
1.25%
jan 1, 2008
14.135
+0.013
0.09%
jan 1, 2009
13.981
-0.154
-1.09%
jan 1, 2010
13.349
-0.631
-4.52%
jan 1, 2011
13.529
+0.18
1.35%
jan 1, 2012
13.824
+0.295
2.18%
jan 1, 2013
13.976
+0.152
1.1%
jan 1, 2014
13.869
-0.107
-0.77%
jan 1, 2015
13.874
+0.005
0.04%
Ranking of countries by current statistics by years


Comments: