29
/
en
AIzaSyAYiBZKx7MnpbEhh9jyipgxe19OcubqV5w
April 1, 2024
50652
Middle income
MIC
false
2
1
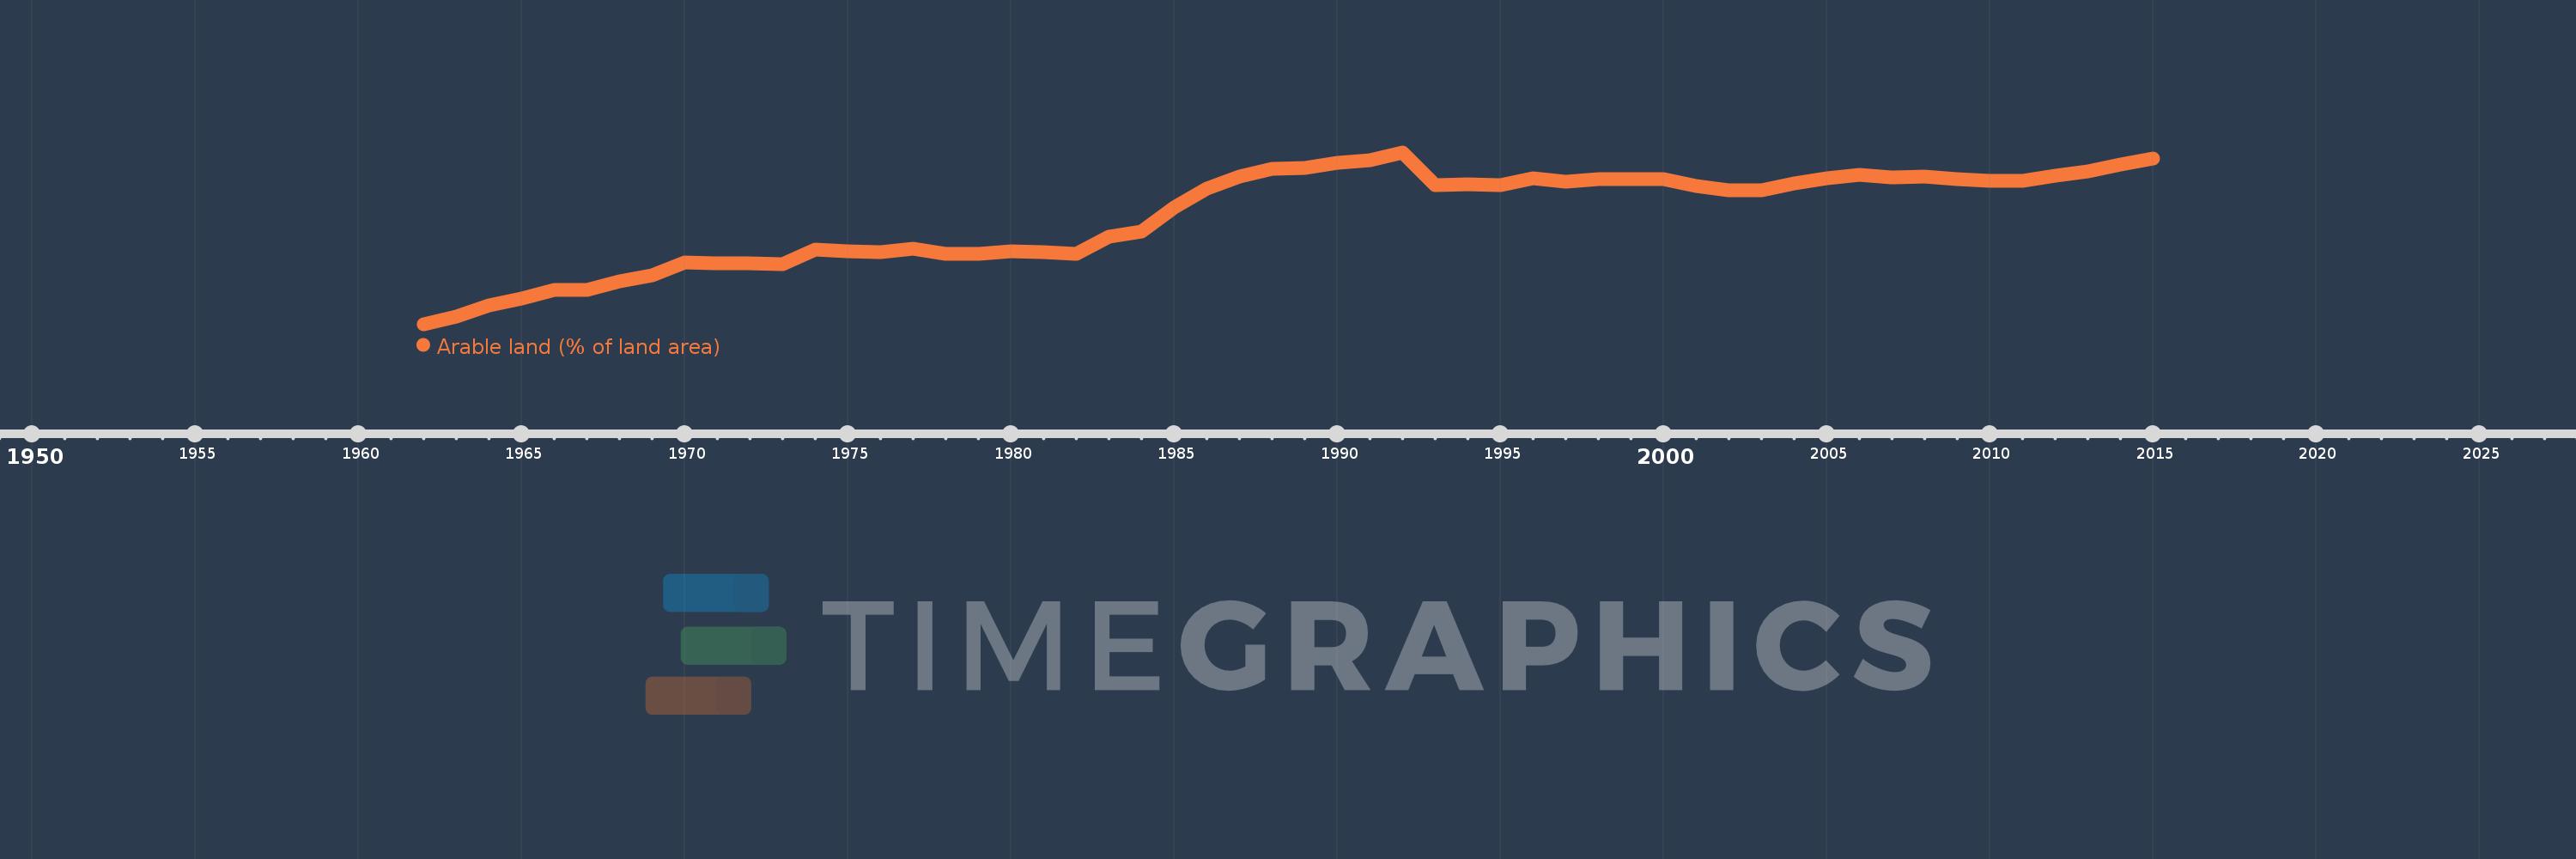
Arable land (% of land area)
2015,2014,2013,2012,2011,2010,2009,2008,2007,2006,2005,2004,2003,2002,2001,2000,1999,1998,1997,1996,1995,1994,1993,1992,1991,1990,1989,1988,1987,1986,1985,1984,1983,1982,1981,1980,1979,1978,1977,1976,1975,1974,1973,1972,1971,1970,1969,1968,1967,1966,1965,1964,1963,1962
This statistics in other country:
AfghanistanAlbaniaAlgeriaAmerican SamoaAndorraAngolaAntigua and BarbudaArab WorldArgentinaArmeniaArubaAustraliaAustriaAzerbaijanBahamas, TheBahrainBangladeshBarbadosBelarusBelgiumBelizeBeninBermudaBhutanBoliviaBosnia and HerzegovinaBotswanaBrazilBritish Virgin IslandsBrunei DarussalamBulgariaBurkina FasoBurundiCabo VerdeCambodiaCameroonCanadaCaribbean small statesCayman IslandsCentral African RepublicCentral Europe and the BalticsChadChannel IslandsChileChinaColombiaComorosCongo, Dem. Rep.Congo, Rep.Costa RicaCote d'IvoireCroatiaCubaCyprusCzech RepublicDenmarkDjiboutiDominicaDominican RepublicEarly-demographic dividendEast Asia & PacificEast Asia & Pacific (excluding high income)East Asia & Pacific (IDA & IBRD countries)EcuadorEgypt, Arab Rep.El SalvadorEquatorial GuineaEritreaEstoniaEthiopiaEuro areaEurope & Central AsiaEurope & Central Asia (excluding high income)Europe & Central Asia (IDA & IBRD countries)European UnionFaroe IslandsFijiFinlandFragile and conflict affected situationsFranceFrench PolynesiaGabonGambia, TheGeorgiaGermanyGhanaGreeceGreenlandGrenadaGuamGuatemalaGuineaGuinea-BissauGuyanaHaitiHeavily indebted poor countries (HIPC)High incomeHondurasHong Kong SAR, ChinaHungaryIBRD onlyIcelandIDA & IBRD totalIDA blendIDA onlyIDA totalIndiaIndonesiaIran, Islamic Rep.IraqIrelandIsle of ManIsraelItalyJamaicaJapanJordanKazakhstanKenyaKiribatiKorea, Dem. People’s Rep.Korea, Rep.KosovoKuwaitKyrgyz RepublicLao PDRLate-demographic dividendLatin America & Caribbean Latin America & Caribbean (excluding high income)Latin America & the Caribbean (IDA & IBRD countries)LatviaLeast developed countries: UN classificationLebanonLesothoLiberiaLibyaLiechtensteinLithuaniaLow & middle incomeLow incomeLower middle incomeLuxembourgMacedonia, FYRMadagascarMalawiMalaysiaMaldivesMaliMaltaMarshall IslandsMauritaniaMauritiusMexicoMicronesia, Fed. Sts.Middle East & North AfricaMiddle East & North Africa (excluding high income)Middle East & North Africa (IDA & IBRD countries)Middle incomeMoldovaMongoliaMontenegroMoroccoMozambiqueMyanmarNamibiaNepalNetherlandsNew CaledoniaNew ZealandNicaraguaNigerNigeriaNorth AmericaNorthern Mariana IslandsNorwayOECD membersOmanOther small statesPacific island small statesPakistanPalauPanamaPapua New GuineaParaguayPeruPhilippinesPolandPortugalPost-demographic dividendPre-demographic dividendPuerto RicoQatarRomaniaRussian FederationRwandaSamoaSan MarinoSao Tome and PrincipeSaudi ArabiaSenegalSerbiaSeychellesSierra LeoneSingaporeSlovak RepublicSloveniaSmall statesSolomon IslandsSomaliaSouth AfricaSouth AsiaSouth Asia (IDA & IBRD)SpainSri LankaSt. Kitts and NevisSt. LuciaSt. Vincent and the GrenadinesSub-Saharan Africa Sub-Saharan Africa (excluding high income)Sub-Saharan Africa (IDA & IBRD countries)SudanSurinameSwazilandSwedenSwitzerlandSyrian Arab RepublicTajikistanTanzaniaThailandTimor-LesteTogoTongaTrinidad and TobagoTunisiaTurkeyTurkmenistanTurks and Caicos IslandsUgandaUkraineUnited Arab EmiratesUnited KingdomUnited StatesUpper middle incomeUruguayUzbekistanVanuatuVenezuela, RBVietnamVirgin Islands (U.S.)West Bank and GazaWorldYemen, Rep.ZambiaZimbabwe Timeline:
This timeline shows a graph from 1962 to 2015 of Middle income. No data until 1961. Number of actual observations by date: 54.
Source name:
World Development Indicators
Source organization:
Food and Agriculture Organization, electronic files and web site.
Categories, topics:
Agriculture & Rural Development, Climate Change, Environment
Last updated:
apr 23, 2017
Indicators value changes by year
Maximum:
11.523
jan 1, 1992
At the date of observation
Value
Absolute change
Change from previous value
jan 1, 1962
9.747
+9.747
0.0%
jan 1, 1963
9.823
+0.075
0.77%
jan 1, 1964
9.939
+0.117
1.19%
jan 1, 1965
10.009
+0.07
0.7%
jan 1, 1966
10.102
+0.093
0.93%
jan 1, 1967
10.104
+0.002
0.02%
jan 1, 1968
10.19
+0.086
0.86%
jan 1, 1969
10.253
+0.062
0.61%
jan 1, 1970
10.388
+0.136
1.32%
jan 1, 1971
10.375
-0.013
-0.13%
jan 1, 1972
10.377
+0.002
0.02%
jan 1, 1973
10.371
-0.006
-0.06%
jan 1, 1974
10.518
+0.147
1.41%
jan 1, 1975
10.497
-0.021
-0.2%
jan 1, 1976
10.492
-0.004
-0.04%
jan 1, 1977
10.531
+0.039
0.37%
jan 1, 1978
10.477
-0.054
-0.52%
jan 1, 1979
10.475
-0.002
-0.02%
jan 1, 1980
10.497
+0.022
0.21%
jan 1, 1981
10.496
-0.001
-0.01%
jan 1, 1982
10.471
-0.025
-0.24%
jan 1, 1983
10.653
+0.181
1.73%
jan 1, 1984
10.709
+0.057
0.53%
jan 1, 1985
10.95
+0.241
2.25%
jan 1, 1986
11.152
+0.202
1.85%
jan 1, 1987
11.272
+0.119
1.07%
jan 1, 1988
11.352
+0.081
0.71%
jan 1, 1989
11.363
+0.011
0.09%
jan 1, 1990
11.413
+0.05
0.44%
jan 1, 1991
11.443
+0.03
0.27%
jan 1, 1992
11.523
+0.08
0.7%
jan 1, 1993
11.189
-0.334
-2.9%
jan 1, 1994
11.192
+0.003
0.03%
jan 1, 1995
11.181
-0.011
-0.1%
jan 1, 1996
11.259
+0.077
0.69%
jan 1, 1997
11.219
-0.039
-0.35%
jan 1, 1998
11.248
+0.029
0.26%
jan 1, 1999
11.244
-0.004
-0.04%
jan 1, 2000
11.245
+0.001
0.01%
jan 1, 2001
11.18
-0.065
-0.58%
jan 1, 2002
11.129
-0.051
-0.46%
jan 1, 2003
11.13
+0.0
0.0%
jan 1, 2004
11.2
+0.07
0.63%
jan 1, 2005
11.258
+0.058
0.52%
jan 1, 2006
11.292
+0.034
0.3%
jan 1, 2007
11.268
-0.024
-0.21%
jan 1, 2008
11.277
+0.009
0.08%
jan 1, 2009
11.251
-0.026
-0.23%
jan 1, 2010
11.225
-0.026
-0.23%
jan 1, 2011
11.233
+0.008
0.07%
jan 1, 2012
11.285
+0.052
0.46%
jan 1, 2013
11.326
+0.041
0.36%
jan 1, 2014
11.398
+0.072
0.64%
jan 1, 2015
11.456
+0.058
0.51%
Ranking of countries by current statistics by years


Comments: