29
/
en
AIzaSyAYiBZKx7MnpbEhh9jyipgxe19OcubqV5w
April 1, 2024
261883
Thailand
THA
true
2
1
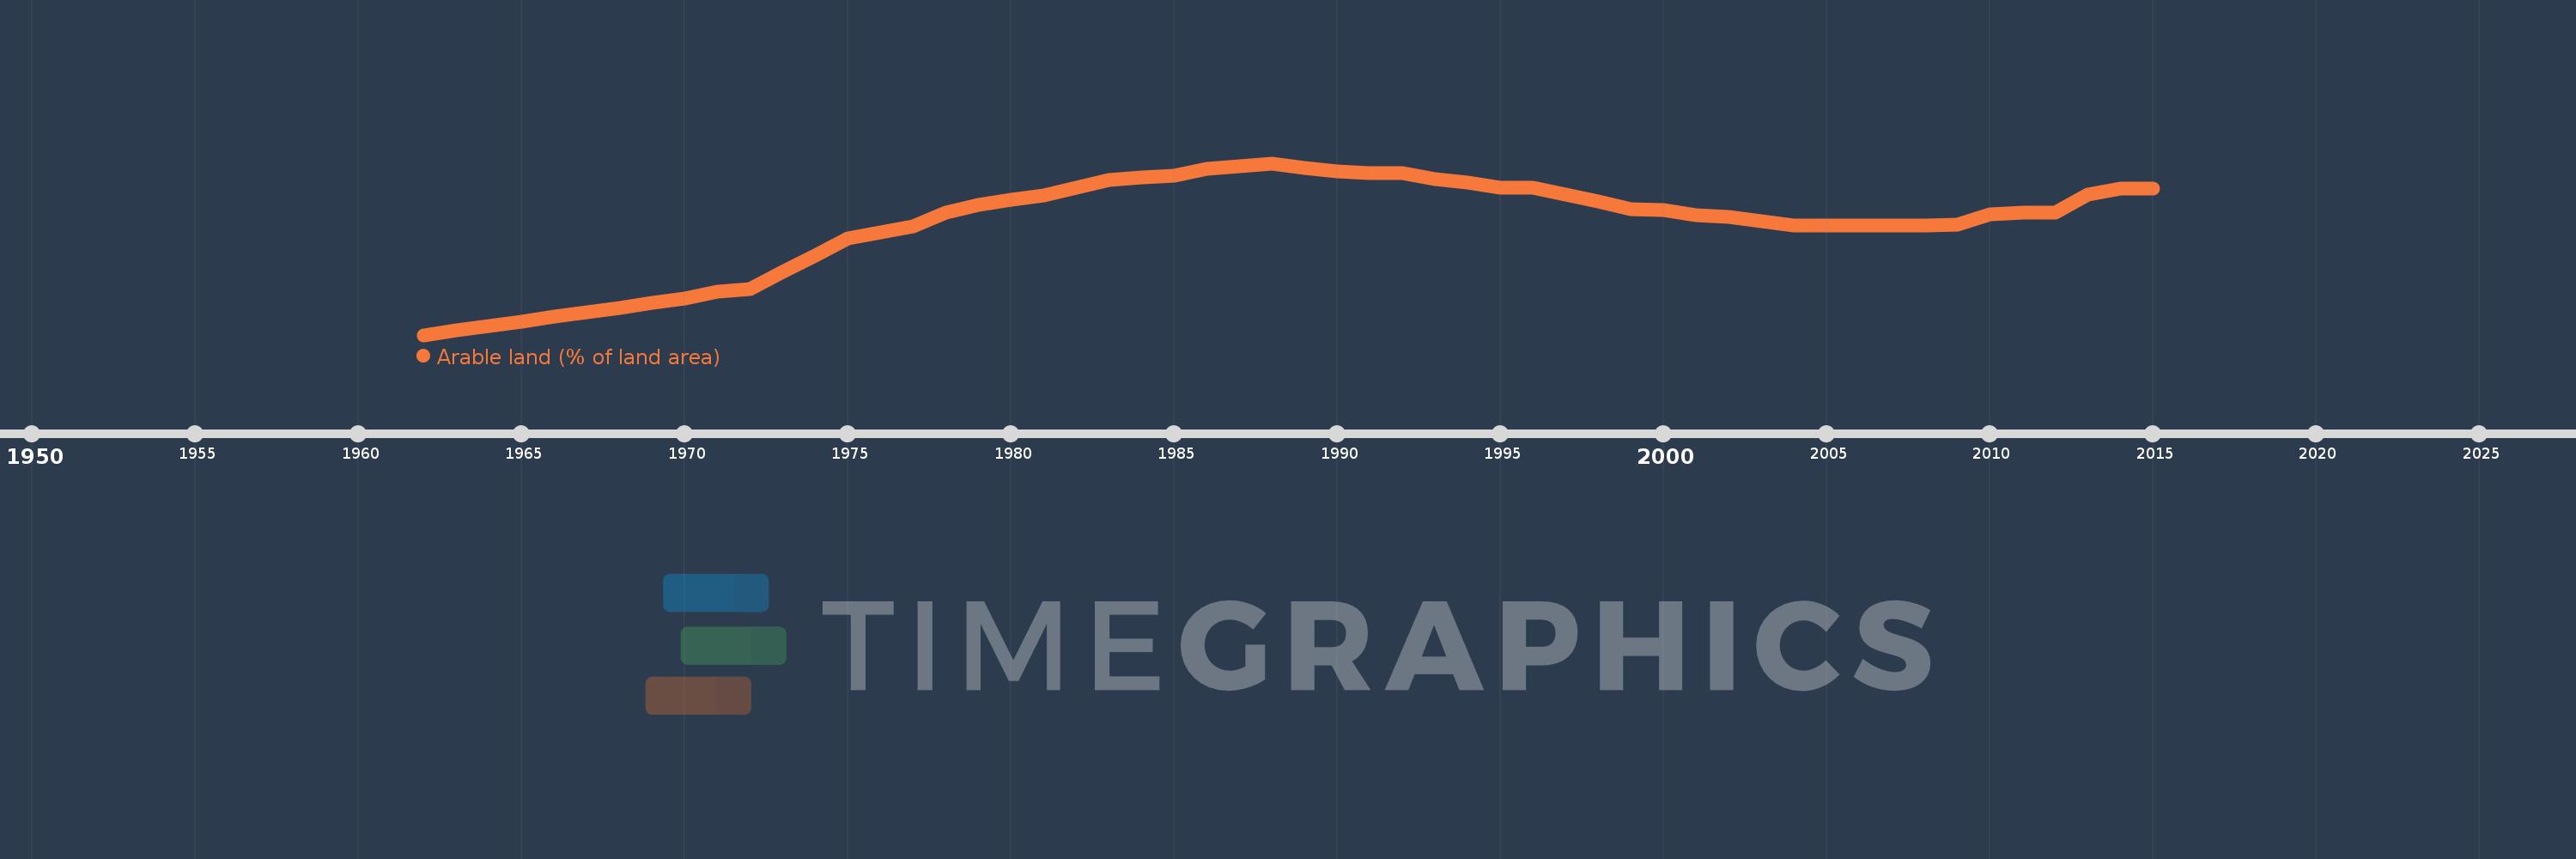
Arable land (% of land area)
2015,2014,2013,2012,2011,2010,2009,2008,2007,2006,2005,2004,2003,2002,2001,2000,1999,1998,1997,1996,1995,1994,1993,1992,1991,1990,1989,1988,1987,1986,1985,1984,1983,1982,1981,1980,1979,1978,1977,1976,1975,1974,1973,1972,1971,1970,1969,1968,1967,1966,1965,1964,1963,1962
This statistics in other country:
AfghanistanAlbaniaAlgeriaAmerican SamoaAndorraAngolaAntigua and BarbudaArab WorldArgentinaArmeniaArubaAustraliaAustriaAzerbaijanBahamas, TheBahrainBangladeshBarbadosBelarusBelgiumBelizeBeninBermudaBhutanBoliviaBosnia and HerzegovinaBotswanaBrazilBritish Virgin IslandsBrunei DarussalamBulgariaBurkina FasoBurundiCabo VerdeCambodiaCameroonCanadaCaribbean small statesCayman IslandsCentral African RepublicCentral Europe and the BalticsChadChannel IslandsChileChinaColombiaComorosCongo, Dem. Rep.Congo, Rep.Costa RicaCote d'IvoireCroatiaCubaCyprusCzech RepublicDenmarkDjiboutiDominicaDominican RepublicEarly-demographic dividendEast Asia & PacificEast Asia & Pacific (excluding high income)East Asia & Pacific (IDA & IBRD countries)EcuadorEgypt, Arab Rep.El SalvadorEquatorial GuineaEritreaEstoniaEthiopiaEuro areaEurope & Central AsiaEurope & Central Asia (excluding high income)Europe & Central Asia (IDA & IBRD countries)European UnionFaroe IslandsFijiFinlandFragile and conflict affected situationsFranceFrench PolynesiaGabonGambia, TheGeorgiaGermanyGhanaGreeceGreenlandGrenadaGuamGuatemalaGuineaGuinea-BissauGuyanaHaitiHeavily indebted poor countries (HIPC)High incomeHondurasHong Kong SAR, ChinaHungaryIBRD onlyIcelandIDA & IBRD totalIDA blendIDA onlyIDA totalIndiaIndonesiaIran, Islamic Rep.IraqIrelandIsle of ManIsraelItalyJamaicaJapanJordanKazakhstanKenyaKiribatiKorea, Dem. People’s Rep.Korea, Rep.KosovoKuwaitKyrgyz RepublicLao PDRLate-demographic dividendLatin America & Caribbean Latin America & Caribbean (excluding high income)Latin America & the Caribbean (IDA & IBRD countries)LatviaLeast developed countries: UN classificationLebanonLesothoLiberiaLibyaLiechtensteinLithuaniaLow & middle incomeLow incomeLower middle incomeLuxembourgMacedonia, FYRMadagascarMalawiMalaysiaMaldivesMaliMaltaMarshall IslandsMauritaniaMauritiusMexicoMicronesia, Fed. Sts.Middle East & North AfricaMiddle East & North Africa (excluding high income)Middle East & North Africa (IDA & IBRD countries)Middle incomeMoldovaMongoliaMontenegroMoroccoMozambiqueMyanmarNamibiaNepalNetherlandsNew CaledoniaNew ZealandNicaraguaNigerNigeriaNorth AmericaNorthern Mariana IslandsNorwayOECD membersOmanOther small statesPacific island small statesPakistanPalauPanamaPapua New GuineaParaguayPeruPhilippinesPolandPortugalPost-demographic dividendPre-demographic dividendPuerto RicoQatarRomaniaRussian FederationRwandaSamoaSan MarinoSao Tome and PrincipeSaudi ArabiaSenegalSerbiaSeychellesSierra LeoneSingaporeSlovak RepublicSloveniaSmall statesSolomon IslandsSomaliaSouth AfricaSouth AsiaSouth Asia (IDA & IBRD)SpainSri LankaSt. Kitts and NevisSt. LuciaSt. Vincent and the GrenadinesSub-Saharan Africa Sub-Saharan Africa (excluding high income)Sub-Saharan Africa (IDA & IBRD countries)SudanSurinameSwazilandSwedenSwitzerlandSyrian Arab RepublicTajikistanTanzaniaThailandTimor-LesteTogoTongaTrinidad and TobagoTunisiaTurkeyTurkmenistanTurks and Caicos IslandsUgandaUkraineUnited Arab EmiratesUnited KingdomUnited StatesUpper middle incomeUruguayUzbekistanVanuatuVenezuela, RBVietnamVirgin Islands (U.S.)West Bank and GazaWorldYemen, Rep.ZambiaZimbabwe Timeline:
This timeline shows a graph from 1962 to 2015 of Thailand. No data until 1961. Number of actual observations by date: 54.
Source name:
World Development Indicators
Source organization:
Food and Agriculture Organization, electronic files and web site.
Categories, topics:
Agriculture & Rural Development, Climate Change, Environment
Last updated:
apr 23, 2017
Indicators value changes by year
Minimum:
20.357
jan 1, 1962
Maximum:
35.096
jan 1, 1988
At the date of observation
Value
Absolute change
Change from previous value
jan 1, 1962
20.357
+20.357
0.0%
jan 1, 1963
20.748
+0.391
1.92%
jan 1, 1964
21.14
+0.391
1.89%
jan 1, 1965
21.531
+0.391
1.85%
jan 1, 1966
21.923
+0.391
1.82%
jan 1, 1967
22.314
+0.391
1.79%
jan 1, 1968
22.705
+0.391
1.75%
jan 1, 1969
23.097
+0.391
1.72%
jan 1, 1970
23.488
+0.391
1.69%
jan 1, 1971
24.076
+0.587
2.5%
jan 1, 1972
24.332
+0.256
1.07%
jan 1, 1973
25.739
+1.407
5.78%
jan 1, 1974
27.207
+1.468
5.7%
jan 1, 1975
28.625
+1.417
5.21%
jan 1, 1976
29.165
+0.54
1.89%
jan 1, 1977
29.682
+0.517
1.77%
jan 1, 1978
30.874
+1.192
4.02%
jan 1, 1979
31.529
+0.656
2.12%
jan 1, 1980
31.934
+0.405
1.29%
jan 1, 1981
32.326
+0.391
1.23%
jan 1, 1982
32.991
+0.666
2.06%
jan 1, 1983
33.665
+0.673
2.04%
jan 1, 1984
33.849
+0.184
0.55%
jan 1, 1985
34.06
+0.211
0.62%
jan 1, 1986
34.632
+0.572
1.68%
jan 1, 1987
34.861
+0.229
0.66%
jan 1, 1988
35.096
+0.235
0.67%
jan 1, 1989
34.7
-0.395
-1.13%
jan 1, 1990
34.412
-0.288
-0.83%
jan 1, 1991
34.242
-0.17
-0.49%
jan 1, 1992
34.274
+0.031
0.09%
jan 1, 1993
33.741
-0.532
-1.55%
jan 1, 1994
33.442
-0.299
-0.89%
jan 1, 1995
33.001
-0.44
-1.32%
jan 1, 1996
32.96
-0.041
-0.12%
jan 1, 1997
32.42
-0.54
-1.64%
jan 1, 1998
31.792
-0.628
-1.94%
jan 1, 1999
31.185
-0.607
-1.91%
jan 1, 2000
31.058
-0.127
-0.41%
jan 1, 2001
30.641
-0.417
-1.34%
jan 1, 2002
30.492
-0.149
-0.49%
jan 1, 2003
30.122
-0.37
-1.21%
jan 1, 2004
29.752
-0.37
-1.23%
jan 1, 2005
29.752
0.0
0.0%
jan 1, 2006
29.752
0.0
0.0%
jan 1, 2007
29.752
0.0
0.0%
jan 1, 2008
29.752
0.0
0.0%
jan 1, 2009
29.85
+0.098
0.33%
jan 1, 2010
30.721
+0.871
2.92%
jan 1, 2011
30.848
+0.127
0.41%
jan 1, 2012
30.848
0.0
0.0%
jan 1, 2013
32.414
+1.566
5.08%
jan 1, 2014
32.903
+0.489
1.51%
jan 1, 2015
32.903
0.0
0.0%
Ranking of countries by current statistics by years


Comments: