29
/
en
AIzaSyAYiBZKx7MnpbEhh9jyipgxe19OcubqV5w
April 1, 2024
276393
United States
USA
true
2
1
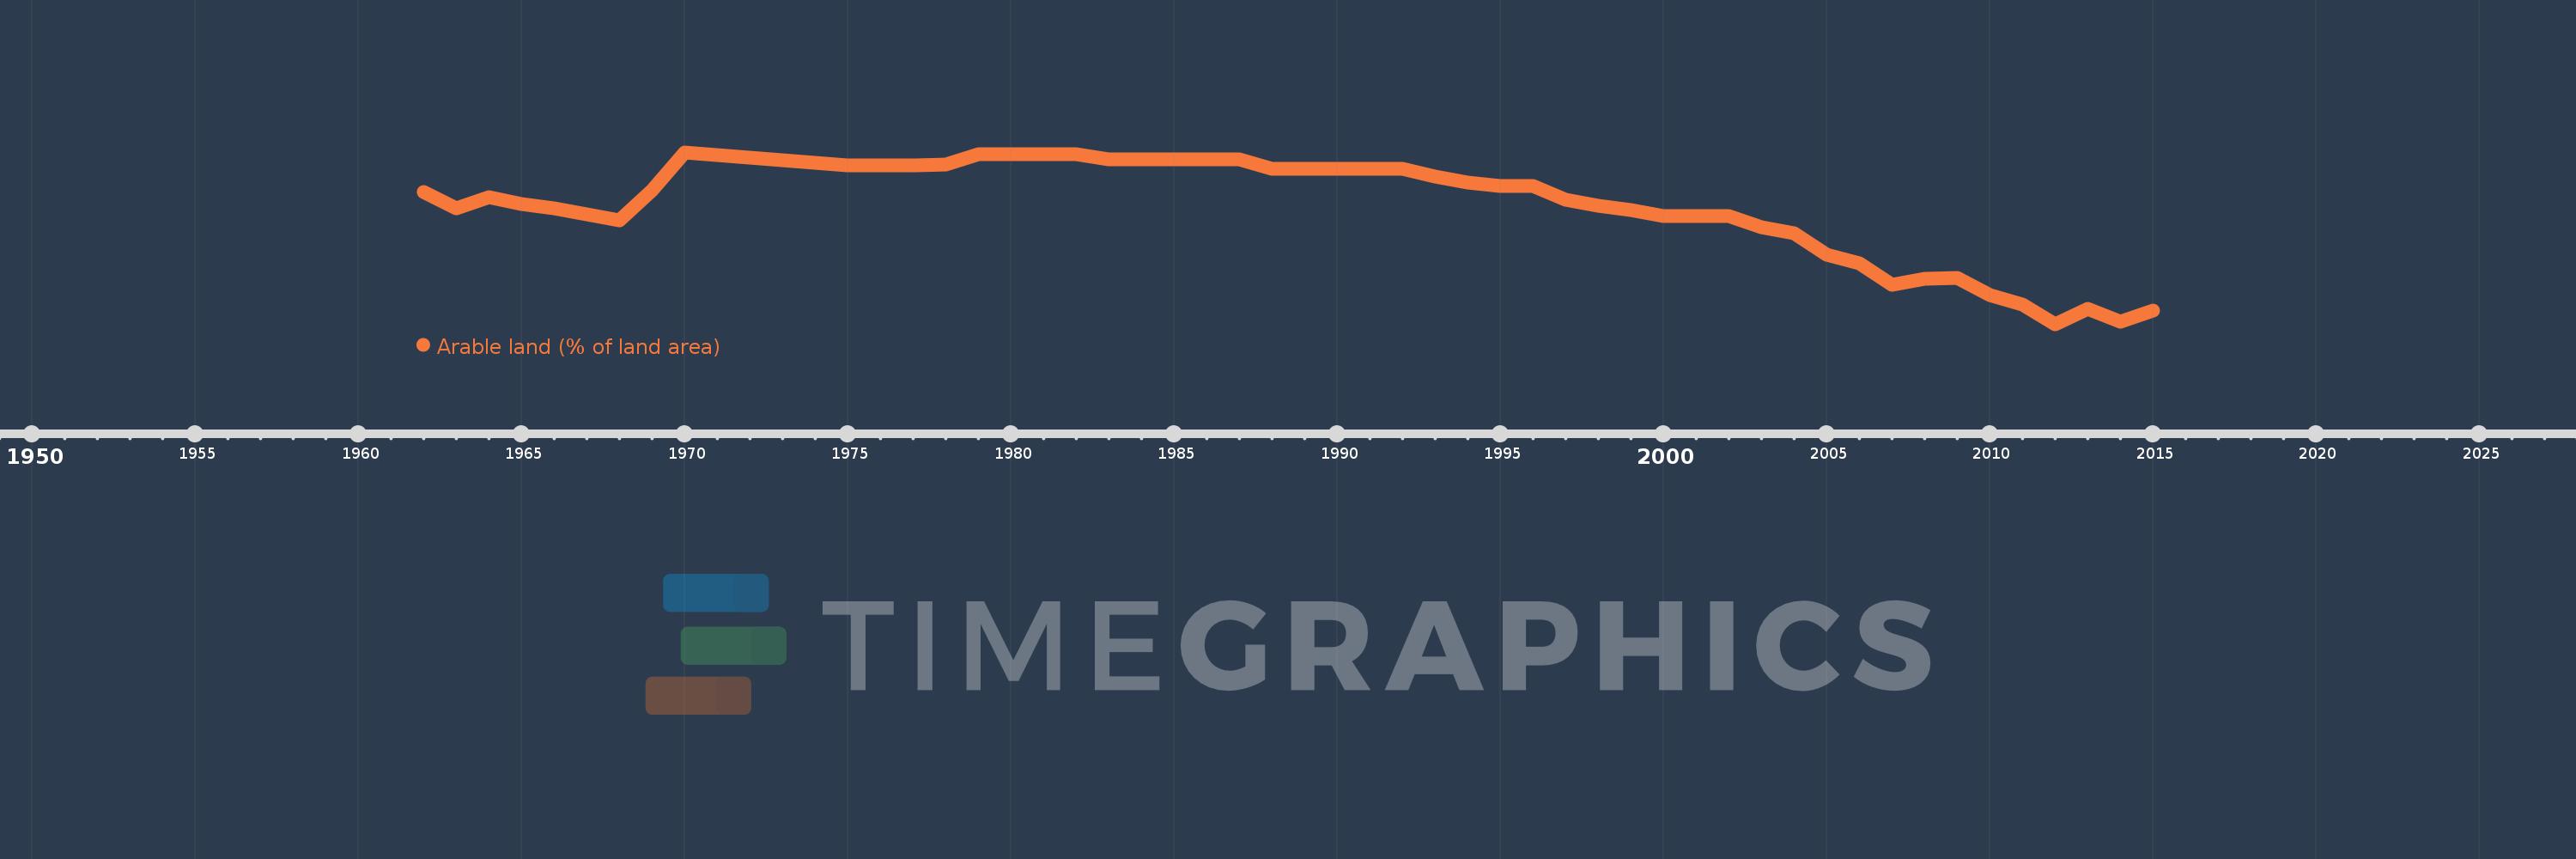
Arable land (% of land area)
2015,2014,2013,2012,2011,2010,2009,2008,2007,2006,2005,2004,2003,2002,2001,2000,1999,1998,1997,1996,1995,1994,1993,1992,1991,1990,1989,1988,1987,1986,1985,1984,1983,1982,1981,1980,1979,1978,1977,1976,1975,1974,1973,1972,1971,1970,1969,1968,1967,1966,1965,1964,1963,1962
This statistics in other country:
AfghanistanAlbaniaAlgeriaAmerican SamoaAndorraAngolaAntigua and BarbudaArab WorldArgentinaArmeniaArubaAustraliaAustriaAzerbaijanBahamas, TheBahrainBangladeshBarbadosBelarusBelgiumBelizeBeninBermudaBhutanBoliviaBosnia and HerzegovinaBotswanaBrazilBritish Virgin IslandsBrunei DarussalamBulgariaBurkina FasoBurundiCabo VerdeCambodiaCameroonCanadaCaribbean small statesCayman IslandsCentral African RepublicCentral Europe and the BalticsChadChannel IslandsChileChinaColombiaComorosCongo, Dem. Rep.Congo, Rep.Costa RicaCote d'IvoireCroatiaCubaCyprusCzech RepublicDenmarkDjiboutiDominicaDominican RepublicEarly-demographic dividendEast Asia & PacificEast Asia & Pacific (excluding high income)East Asia & Pacific (IDA & IBRD countries)EcuadorEgypt, Arab Rep.El SalvadorEquatorial GuineaEritreaEstoniaEthiopiaEuro areaEurope & Central AsiaEurope & Central Asia (excluding high income)Europe & Central Asia (IDA & IBRD countries)European UnionFaroe IslandsFijiFinlandFragile and conflict affected situationsFranceFrench PolynesiaGabonGambia, TheGeorgiaGermanyGhanaGreeceGreenlandGrenadaGuamGuatemalaGuineaGuinea-BissauGuyanaHaitiHeavily indebted poor countries (HIPC)High incomeHondurasHong Kong SAR, ChinaHungaryIBRD onlyIcelandIDA & IBRD totalIDA blendIDA onlyIDA totalIndiaIndonesiaIran, Islamic Rep.IraqIrelandIsle of ManIsraelItalyJamaicaJapanJordanKazakhstanKenyaKiribatiKorea, Dem. People’s Rep.Korea, Rep.KosovoKuwaitKyrgyz RepublicLao PDRLate-demographic dividendLatin America & Caribbean Latin America & Caribbean (excluding high income)Latin America & the Caribbean (IDA & IBRD countries)LatviaLeast developed countries: UN classificationLebanonLesothoLiberiaLibyaLiechtensteinLithuaniaLow & middle incomeLow incomeLower middle incomeLuxembourgMacedonia, FYRMadagascarMalawiMalaysiaMaldivesMaliMaltaMarshall IslandsMauritaniaMauritiusMexicoMicronesia, Fed. Sts.Middle East & North AfricaMiddle East & North Africa (excluding high income)Middle East & North Africa (IDA & IBRD countries)Middle incomeMoldovaMongoliaMontenegroMoroccoMozambiqueMyanmarNamibiaNepalNetherlandsNew CaledoniaNew ZealandNicaraguaNigerNigeriaNorth AmericaNorthern Mariana IslandsNorwayOECD membersOmanOther small statesPacific island small statesPakistanPalauPanamaPapua New GuineaParaguayPeruPhilippinesPolandPortugalPost-demographic dividendPre-demographic dividendPuerto RicoQatarRomaniaRussian FederationRwandaSamoaSan MarinoSao Tome and PrincipeSaudi ArabiaSenegalSerbiaSeychellesSierra LeoneSingaporeSlovak RepublicSloveniaSmall statesSolomon IslandsSomaliaSouth AfricaSouth AsiaSouth Asia (IDA & IBRD)SpainSri LankaSt. Kitts and NevisSt. LuciaSt. Vincent and the GrenadinesSub-Saharan Africa Sub-Saharan Africa (excluding high income)Sub-Saharan Africa (IDA & IBRD countries)SudanSurinameSwazilandSwedenSwitzerlandSyrian Arab RepublicTajikistanTanzaniaThailandTimor-LesteTogoTongaTrinidad and TobagoTunisiaTurkeyTurkmenistanTurks and Caicos IslandsUgandaUkraineUnited Arab EmiratesUnited KingdomUnited StatesUpper middle incomeUruguayUzbekistanVanuatuVenezuela, RBVietnamVirgin Islands (U.S.)West Bank and GazaWorldYemen, Rep.ZambiaZimbabwe Timeline:
This timeline shows a graph from 1962 to 2015 of United States. No data until 1961. Number of actual observations by date: 54.
Source name:
World Development Indicators
Source organization:
Food and Agriculture Organization, electronic files and web site.
Categories, topics:
Agriculture & Rural Development, Climate Change, Environment
Last updated:
apr 23, 2017
Indicators value changes by year
Minimum:
16.581
jan 1, 2012
Maximum:
20.662
jan 1, 1970
At the date of observation
Value
Absolute change
Change from previous value
jan 1, 1962
19.722
+19.722
0.0%
jan 1, 1963
19.336
-0.386
-1.96%
jan 1, 1964
19.606
+0.271
1.4%
jan 1, 1965
19.431
-0.176
-0.9%
jan 1, 1966
19.325
-0.105
-0.54%
jan 1, 1967
19.184
-0.141
-0.73%
jan 1, 1968
19.051
-0.133
-0.69%
jan 1, 1969
19.762
+0.711
3.73%
jan 1, 1970
20.662
+0.9
4.55%
jan 1, 1971
20.607
-0.056
-0.27%
jan 1, 1972
20.542
-0.065
-0.32%
jan 1, 1973
20.477
-0.065
-0.32%
jan 1, 1974
20.423
-0.054
-0.26%
jan 1, 1975
20.36
-0.063
-0.31%
jan 1, 1976
20.36
0.0
0.0%
jan 1, 1977
20.36
0.0
0.0%
jan 1, 1978
20.368
+0.009
0.04%
jan 1, 1979
20.609
+0.241
1.18%
jan 1, 1980
20.609
0.0
0.0%
jan 1, 1981
20.609
0.0
0.0%
jan 1, 1982
20.609
0.0
0.0%
jan 1, 1983
20.501
-0.108
-0.52%
jan 1, 1984
20.501
0.0
0.0%
jan 1, 1985
20.501
0.0
0.0%
jan 1, 1986
20.501
0.0
0.0%
jan 1, 1987
20.501
0.0
0.0%
jan 1, 1988
20.28
-0.221
-1.08%
jan 1, 1989
20.28
0.0
0.0%
jan 1, 1990
20.278
-0.002
-0.01%
jan 1, 1991
20.273
-0.005
-0.03%
jan 1, 1992
20.273
0.0
0.0%
jan 1, 1993
20.098
-0.174
-0.86%
jan 1, 1994
19.953
-0.145
-0.72%
jan 1, 1995
19.865
-0.088
-0.44%
jan 1, 1996
19.854
-0.011
-0.05%
jan 1, 1997
19.544
-0.309
-1.56%
jan 1, 1998
19.39
-0.154
-0.79%
jan 1, 1999
19.302
-0.088
-0.46%
jan 1, 2000
19.147
-0.154
-0.8%
jan 1, 2001
19.141
-0.006
-0.03%
jan 1, 2002
19.144
+0.003
0.02%
jan 1, 2003
18.88
-0.264
-1.38%
jan 1, 2004
18.733
-0.147
-0.78%
jan 1, 2005
18.234
-0.5
-2.67%
jan 1, 2006
18.022
-0.212
-1.16%
jan 1, 2007
17.512
-0.51
-2.83%
jan 1, 2008
17.669
+0.157
0.9%
jan 1, 2009
17.689
+0.021
0.12%
jan 1, 2010
17.268
-0.421
-2.38%
jan 1, 2011
17.046
-0.222
-1.29%
jan 1, 2012
16.581
-0.465
-2.73%
jan 1, 2013
16.956
+0.376
2.27%
jan 1, 2014
16.643
-0.313
-1.85%
jan 1, 2015
16.901
+0.258
1.55%
Ranking of countries by current statistics by years


Comments: