29
/
en
AIzaSyAYiBZKx7MnpbEhh9jyipgxe19OcubqV5w
April 1, 2024
124460
Egypt, Arab Rep.
EGY
true
2
1
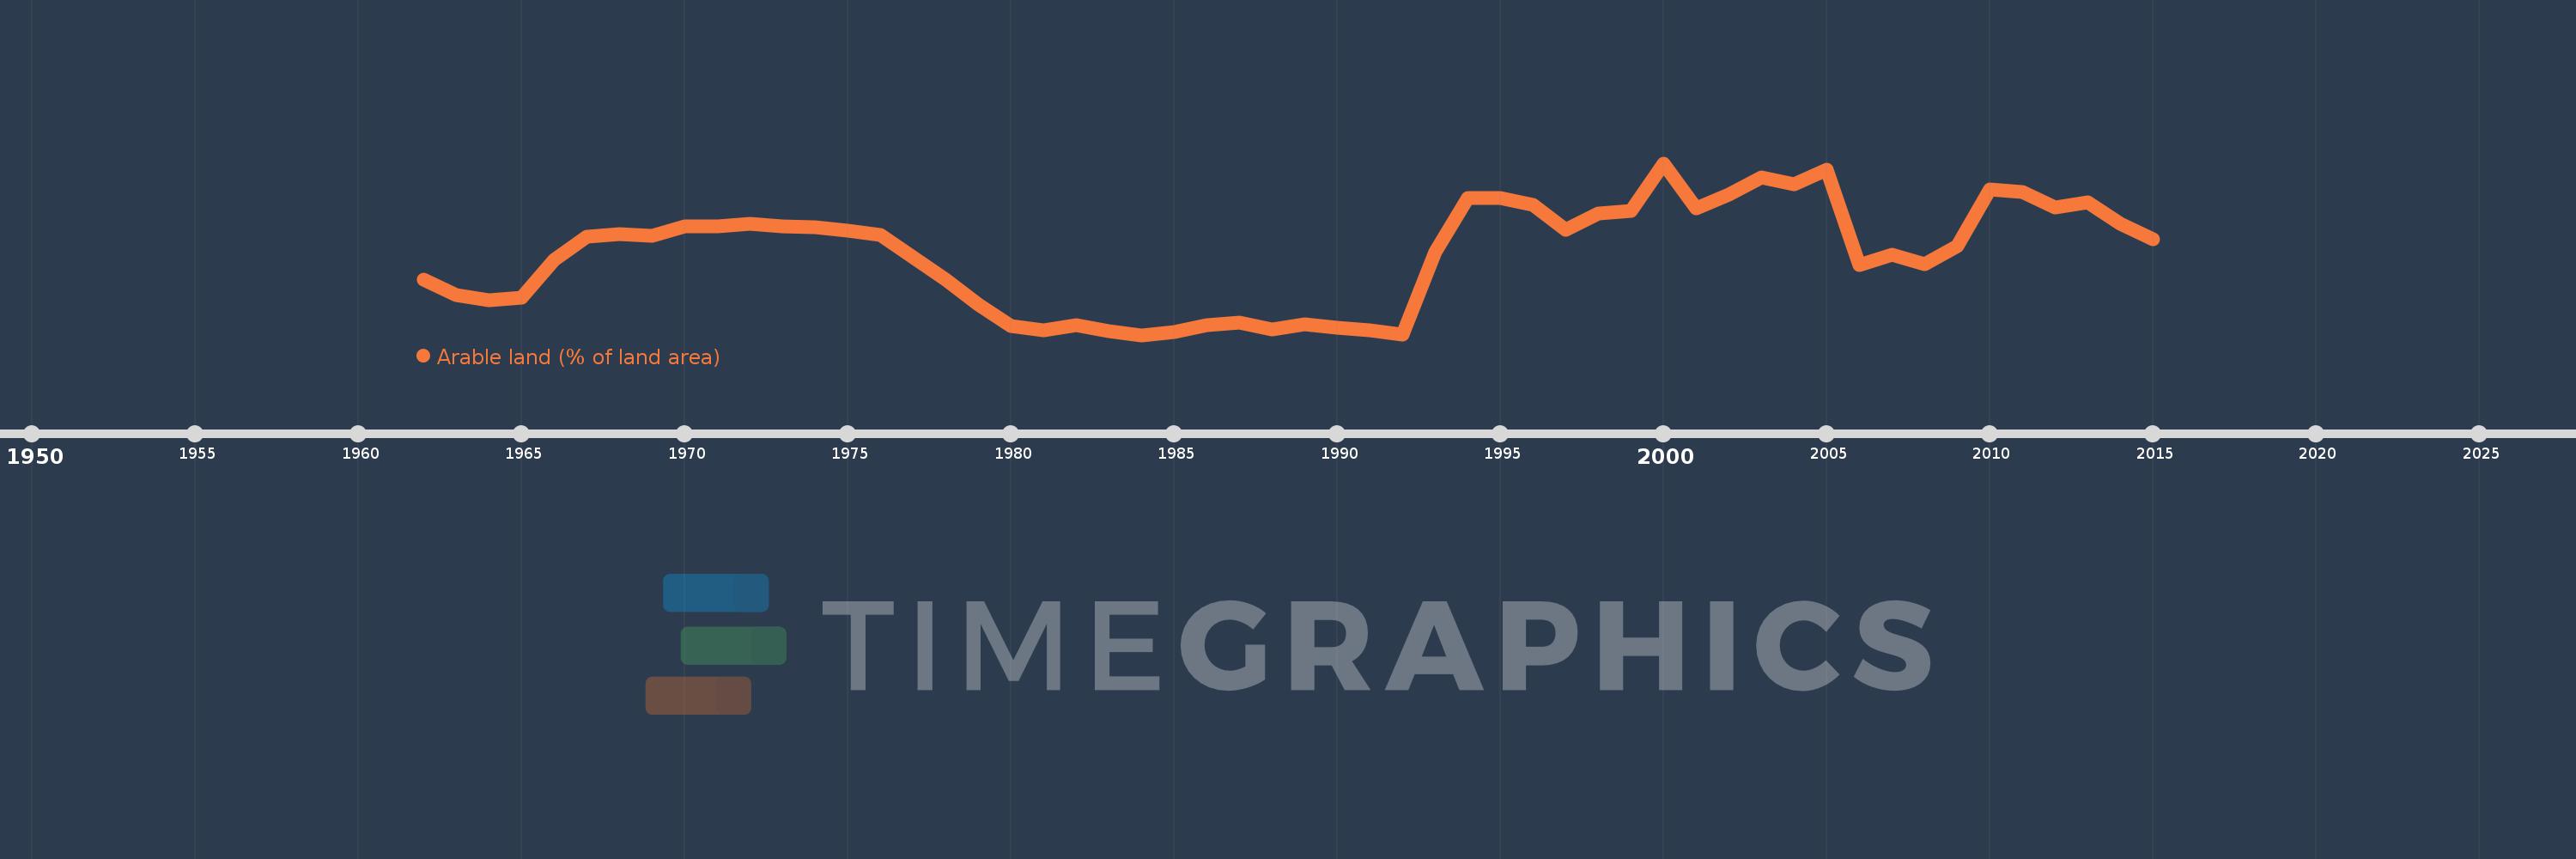
Arable land (% of land area)
2015,2014,2013,2012,2011,2010,2009,2008,2007,2006,2005,2004,2003,2002,2001,2000,1999,1998,1997,1996,1995,1994,1993,1992,1991,1990,1989,1988,1987,1986,1985,1984,1983,1982,1981,1980,1979,1978,1977,1976,1975,1974,1973,1972,1971,1970,1969,1968,1967,1966,1965,1964,1963,1962
This statistics in other country:
AfghanistanAlbaniaAlgeriaAmerican SamoaAndorraAngolaAntigua and BarbudaArab WorldArgentinaArmeniaArubaAustraliaAustriaAzerbaijanBahamas, TheBahrainBangladeshBarbadosBelarusBelgiumBelizeBeninBermudaBhutanBoliviaBosnia and HerzegovinaBotswanaBrazilBritish Virgin IslandsBrunei DarussalamBulgariaBurkina FasoBurundiCabo VerdeCambodiaCameroonCanadaCaribbean small statesCayman IslandsCentral African RepublicCentral Europe and the BalticsChadChannel IslandsChileChinaColombiaComorosCongo, Dem. Rep.Congo, Rep.Costa RicaCote d'IvoireCroatiaCubaCyprusCzech RepublicDenmarkDjiboutiDominicaDominican RepublicEarly-demographic dividendEast Asia & PacificEast Asia & Pacific (excluding high income)East Asia & Pacific (IDA & IBRD countries)EcuadorEgypt, Arab Rep.El SalvadorEquatorial GuineaEritreaEstoniaEthiopiaEuro areaEurope & Central AsiaEurope & Central Asia (excluding high income)Europe & Central Asia (IDA & IBRD countries)European UnionFaroe IslandsFijiFinlandFragile and conflict affected situationsFranceFrench PolynesiaGabonGambia, TheGeorgiaGermanyGhanaGreeceGreenlandGrenadaGuamGuatemalaGuineaGuinea-BissauGuyanaHaitiHeavily indebted poor countries (HIPC)High incomeHondurasHong Kong SAR, ChinaHungaryIBRD onlyIcelandIDA & IBRD totalIDA blendIDA onlyIDA totalIndiaIndonesiaIran, Islamic Rep.IraqIrelandIsle of ManIsraelItalyJamaicaJapanJordanKazakhstanKenyaKiribatiKorea, Dem. People’s Rep.Korea, Rep.KosovoKuwaitKyrgyz RepublicLao PDRLate-demographic dividendLatin America & Caribbean Latin America & Caribbean (excluding high income)Latin America & the Caribbean (IDA & IBRD countries)LatviaLeast developed countries: UN classificationLebanonLesothoLiberiaLibyaLiechtensteinLithuaniaLow & middle incomeLow incomeLower middle incomeLuxembourgMacedonia, FYRMadagascarMalawiMalaysiaMaldivesMaliMaltaMarshall IslandsMauritaniaMauritiusMexicoMicronesia, Fed. Sts.Middle East & North AfricaMiddle East & North Africa (excluding high income)Middle East & North Africa (IDA & IBRD countries)Middle incomeMoldovaMongoliaMontenegroMoroccoMozambiqueMyanmarNamibiaNepalNetherlandsNew CaledoniaNew ZealandNicaraguaNigerNigeriaNorth AmericaNorthern Mariana IslandsNorwayOECD membersOmanOther small statesPacific island small statesPakistanPalauPanamaPapua New GuineaParaguayPeruPhilippinesPolandPortugalPost-demographic dividendPre-demographic dividendPuerto RicoQatarRomaniaRussian FederationRwandaSamoaSan MarinoSao Tome and PrincipeSaudi ArabiaSenegalSerbiaSeychellesSierra LeoneSingaporeSlovak RepublicSloveniaSmall statesSolomon IslandsSomaliaSouth AfricaSouth AsiaSouth Asia (IDA & IBRD)SpainSri LankaSt. Kitts and NevisSt. LuciaSt. Vincent and the GrenadinesSub-Saharan Africa Sub-Saharan Africa (excluding high income)Sub-Saharan Africa (IDA & IBRD countries)SudanSurinameSwazilandSwedenSwitzerlandSyrian Arab RepublicTajikistanTanzaniaThailandTimor-LesteTogoTongaTrinidad and TobagoTunisiaTurkeyTurkmenistanTurks and Caicos IslandsUgandaUkraineUnited Arab EmiratesUnited KingdomUnited StatesUpper middle incomeUruguayUzbekistanVanuatuVenezuela, RBVietnamVirgin Islands (U.S.)West Bank and GazaWorldYemen, Rep.ZambiaZimbabwe Timeline:
This timeline shows a graph from 1962 to 2015 of Egypt, Arab Rep.. No data until 1961. Number of actual observations by date: 54.
Source name:
World Development Indicators
Source organization:
Food and Agriculture Organization, electronic files and web site.
Categories, topics:
Agriculture & Rural Development, Climate Change, Environment
Last updated:
apr 23, 2017
Indicators value changes by year
At the date of observation
Value
Absolute change
Change from previous value
jan 1, 1962
2.51
+2.51
0.0%
jan 1, 1963
2.444
-0.066
-2.64%
jan 1, 1964
2.424
-0.02
-0.82%
jan 1, 1965
2.433
+0.009
0.37%
jan 1, 1966
2.594
+0.161
6.61%
jan 1, 1967
2.695
+0.101
3.91%
jan 1, 1968
2.706
+0.011
0.41%
jan 1, 1969
2.699
-0.007
-0.26%
jan 1, 1970
2.737
+0.038
1.41%
jan 1, 1971
2.737
0.0
0.0%
jan 1, 1972
2.748
+0.01
0.37%
jan 1, 1973
2.737
-0.01
-0.37%
jan 1, 1974
2.735
-0.002
-0.07%
jan 1, 1975
2.719
-0.016
-0.59%
jan 1, 1976
2.703
-0.016
-0.59%
jan 1, 1977
2.608
-0.095
-3.53%
jan 1, 1978
2.51
-0.097
-3.74%
jan 1, 1979
2.406
-0.104
-4.16%
jan 1, 1980
2.315
-0.091
-3.8%
jan 1, 1981
2.296
-0.018
-0.78%
jan 1, 1982
2.318
+0.021
0.92%
jan 1, 1983
2.292
-0.026
-1.12%
jan 1, 1984
2.275
-0.017
-0.72%
jan 1, 1985
2.286
+0.011
0.46%
jan 1, 1986
2.316
+0.03
1.31%
jan 1, 1987
2.329
+0.013
0.56%
jan 1, 1988
2.298
-0.03
-1.29%
jan 1, 1989
2.321
+0.022
0.96%
jan 1, 1990
2.306
-0.014
-0.61%
jan 1, 1991
2.294
-0.012
-0.52%
jan 1, 1992
2.277
-0.017
-0.74%
jan 1, 1993
2.627
+0.35
15.36%
jan 1, 1994
2.86
+0.233
8.86%
jan 1, 1995
2.859
-0.001
-0.04%
jan 1, 1996
2.83
-0.029
-1.02%
jan 1, 1997
2.723
-0.107
-3.78%
jan 1, 1998
2.792
+0.069
2.53%
jan 1, 1999
2.806
+0.015
0.53%
jan 1, 2000
3.008
+0.201
7.17%
jan 1, 2001
2.814
-0.194
-6.45%
jan 1, 2002
2.874
+0.06
2.14%
jan 1, 2003
2.949
+0.075
2.62%
jan 1, 2004
2.919
-0.03
-1.02%
jan 1, 2005
2.979
+0.059
2.03%
jan 1, 2006
2.575
-0.404
-13.56%
jan 1, 2007
2.617
+0.042
1.64%
jan 1, 2008
2.576
-0.041
-1.57%
jan 1, 2009
2.654
+0.078
3.04%
jan 1, 2010
2.897
+0.243
9.16%
jan 1, 2011
2.886
-0.011
-0.38%
jan 1, 2012
2.821
-0.065
-2.26%
jan 1, 2013
2.842
+0.021
0.75%
jan 1, 2014
2.751
-0.091
-3.22%
jan 1, 2015
2.682
-0.068
-2.48%
Ranking of countries by current statistics by years


Comments: