29
/
en
AIzaSyAYiBZKx7MnpbEhh9jyipgxe19OcubqV5w
April 1, 2024
53228
Other small states
OSS
false
2
1
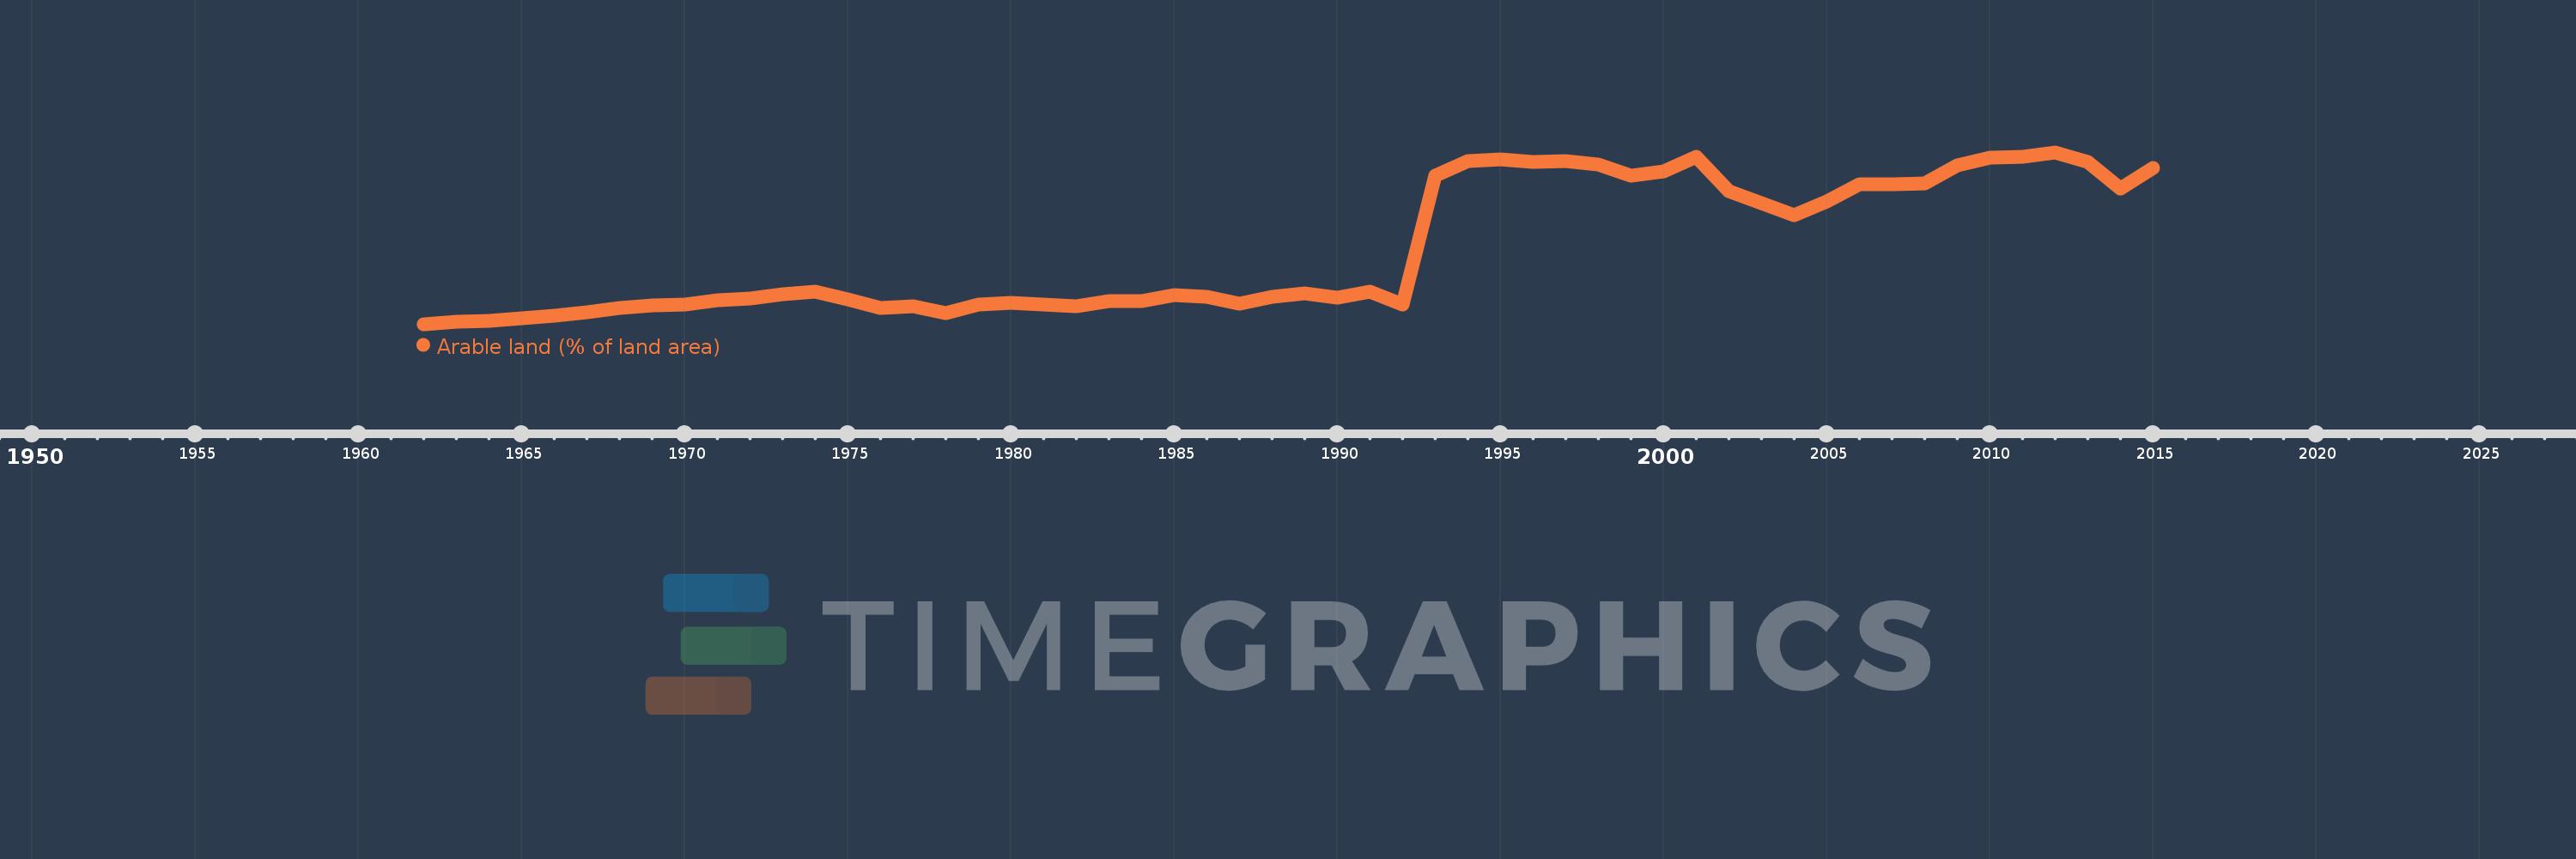
Arable land (% of land area)
2015,2014,2013,2012,2011,2010,2009,2008,2007,2006,2005,2004,2003,2002,2001,2000,1999,1998,1997,1996,1995,1994,1993,1992,1991,1990,1989,1988,1987,1986,1985,1984,1983,1982,1981,1980,1979,1978,1977,1976,1975,1974,1973,1972,1971,1970,1969,1968,1967,1966,1965,1964,1963,1962
This statistics in other country:
AfghanistanAlbaniaAlgeriaAmerican SamoaAndorraAngolaAntigua and BarbudaArab WorldArgentinaArmeniaArubaAustraliaAustriaAzerbaijanBahamas, TheBahrainBangladeshBarbadosBelarusBelgiumBelizeBeninBermudaBhutanBoliviaBosnia and HerzegovinaBotswanaBrazilBritish Virgin IslandsBrunei DarussalamBulgariaBurkina FasoBurundiCabo VerdeCambodiaCameroonCanadaCaribbean small statesCayman IslandsCentral African RepublicCentral Europe and the BalticsChadChannel IslandsChileChinaColombiaComorosCongo, Dem. Rep.Congo, Rep.Costa RicaCote d'IvoireCroatiaCubaCyprusCzech RepublicDenmarkDjiboutiDominicaDominican RepublicEarly-demographic dividendEast Asia & PacificEast Asia & Pacific (excluding high income)East Asia & Pacific (IDA & IBRD countries)EcuadorEgypt, Arab Rep.El SalvadorEquatorial GuineaEritreaEstoniaEthiopiaEuro areaEurope & Central AsiaEurope & Central Asia (excluding high income)Europe & Central Asia (IDA & IBRD countries)European UnionFaroe IslandsFijiFinlandFragile and conflict affected situationsFranceFrench PolynesiaGabonGambia, TheGeorgiaGermanyGhanaGreeceGreenlandGrenadaGuamGuatemalaGuineaGuinea-BissauGuyanaHaitiHeavily indebted poor countries (HIPC)High incomeHondurasHong Kong SAR, ChinaHungaryIBRD onlyIcelandIDA & IBRD totalIDA blendIDA onlyIDA totalIndiaIndonesiaIran, Islamic Rep.IraqIrelandIsle of ManIsraelItalyJamaicaJapanJordanKazakhstanKenyaKiribatiKorea, Dem. People’s Rep.Korea, Rep.KosovoKuwaitKyrgyz RepublicLao PDRLate-demographic dividendLatin America & Caribbean Latin America & Caribbean (excluding high income)Latin America & the Caribbean (IDA & IBRD countries)LatviaLeast developed countries: UN classificationLebanonLesothoLiberiaLibyaLiechtensteinLithuaniaLow & middle incomeLow incomeLower middle incomeLuxembourgMacedonia, FYRMadagascarMalawiMalaysiaMaldivesMaliMaltaMarshall IslandsMauritaniaMauritiusMexicoMicronesia, Fed. Sts.Middle East & North AfricaMiddle East & North Africa (excluding high income)Middle East & North Africa (IDA & IBRD countries)Middle incomeMoldovaMongoliaMontenegroMoroccoMozambiqueMyanmarNamibiaNepalNetherlandsNew CaledoniaNew ZealandNicaraguaNigerNigeriaNorth AmericaNorthern Mariana IslandsNorwayOECD membersOmanOther small statesPacific island small statesPakistanPalauPanamaPapua New GuineaParaguayPeruPhilippinesPolandPortugalPost-demographic dividendPre-demographic dividendPuerto RicoQatarRomaniaRussian FederationRwandaSamoaSan MarinoSao Tome and PrincipeSaudi ArabiaSenegalSerbiaSeychellesSierra LeoneSingaporeSlovak RepublicSloveniaSmall statesSolomon IslandsSomaliaSouth AfricaSouth AsiaSouth Asia (IDA & IBRD)SpainSri LankaSt. Kitts and NevisSt. LuciaSt. Vincent and the GrenadinesSub-Saharan Africa Sub-Saharan Africa (excluding high income)Sub-Saharan Africa (IDA & IBRD countries)SudanSurinameSwazilandSwedenSwitzerlandSyrian Arab RepublicTajikistanTanzaniaThailandTimor-LesteTogoTongaTrinidad and TobagoTunisiaTurkeyTurkmenistanTurks and Caicos IslandsUgandaUkraineUnited Arab EmiratesUnited KingdomUnited StatesUpper middle incomeUruguayUzbekistanVanuatuVenezuela, RBVietnamVirgin Islands (U.S.)West Bank and GazaWorldYemen, Rep.ZambiaZimbabwe Timeline:
This timeline shows a graph from 1962 to 2015 of Other small states. No data until 1961. Number of actual observations by date: 54.
Source name:
World Development Indicators
Source organization:
Food and Agriculture Organization, electronic files and web site.
Categories, topics:
Agriculture & Rural Development, Climate Change, Environment
Last updated:
apr 23, 2017
Indicators value changes by year
At the date of observation
Value
Absolute change
Change from previous value
jan 1, 1962
1.472
+1.472
0.0%
jan 1, 1963
1.481
+0.01
0.65%
jan 1, 1964
1.485
+0.004
0.27%
jan 1, 1965
1.494
+0.009
0.61%
jan 1, 1966
1.504
+0.01
0.64%
jan 1, 1967
1.517
+0.013
0.87%
jan 1, 1968
1.534
+0.017
1.13%
jan 1, 1969
1.544
+0.01
0.62%
jan 1, 1970
1.547
+0.004
0.23%
jan 1, 1971
1.562
+0.015
0.98%
jan 1, 1972
1.568
+0.005
0.32%
jan 1, 1973
1.583
+0.016
1.0%
jan 1, 1974
1.595
+0.012
0.76%
jan 1, 1975
1.565
-0.03
-1.86%
jan 1, 1976
1.534
-0.031
-1.98%
jan 1, 1977
1.541
+0.006
0.41%
jan 1, 1978
1.514
-0.027
-1.77%
jan 1, 1979
1.547
+0.033
2.2%
jan 1, 1980
1.553
+0.007
0.42%
jan 1, 1981
1.547
-0.006
-0.42%
jan 1, 1982
1.539
-0.007
-0.48%
jan 1, 1983
1.558
+0.018
1.2%
jan 1, 1984
1.559
+0.002
0.1%
jan 1, 1985
1.58
+0.021
1.33%
jan 1, 1986
1.574
-0.006
-0.39%
jan 1, 1987
1.55
-0.024
-1.52%
jan 1, 1988
1.575
+0.025
1.63%
jan 1, 1989
1.589
+0.014
0.9%
jan 1, 1990
1.572
-0.017
-1.08%
jan 1, 1991
1.595
+0.023
1.45%
jan 1, 1992
1.546
-0.049
-3.08%
jan 1, 1993
2.029
+0.483
31.22%
jan 1, 1994
2.083
+0.054
2.68%
jan 1, 1995
2.09
+0.007
0.36%
jan 1, 1996
2.08
-0.011
-0.5%
jan 1, 1997
2.085
+0.005
0.24%
jan 1, 1998
2.072
-0.012
-0.59%
jan 1, 1999
2.028
-0.044
-2.13%
jan 1, 2000
2.046
+0.018
0.88%
jan 1, 2001
2.101
+0.055
2.67%
jan 1, 2002
1.972
-0.129
-6.16%
jan 1, 2003
1.927
-0.044
-2.24%
jan 1, 2004
1.882
-0.046
-2.38%
jan 1, 2005
1.934
+0.053
2.79%
jan 1, 2006
1.998
+0.064
3.32%
jan 1, 2007
1.997
-0.001
-0.05%
jan 1, 2008
2.0
+0.003
0.14%
jan 1, 2009
2.068
+0.068
3.38%
jan 1, 2010
2.096
+0.028
1.34%
jan 1, 2011
2.099
+0.003
0.16%
jan 1, 2012
2.117
+0.018
0.84%
jan 1, 2013
2.08
-0.036
-1.71%
jan 1, 2014
1.98
-0.101
-4.84%
jan 1, 2015
2.06
+0.08
4.06%
Ranking of countries by current statistics by years


Comments: