29
/
en
AIzaSyAYiBZKx7MnpbEhh9jyipgxe19OcubqV5w
April 1, 2024
227173
Qatar
QAT
true
2
1
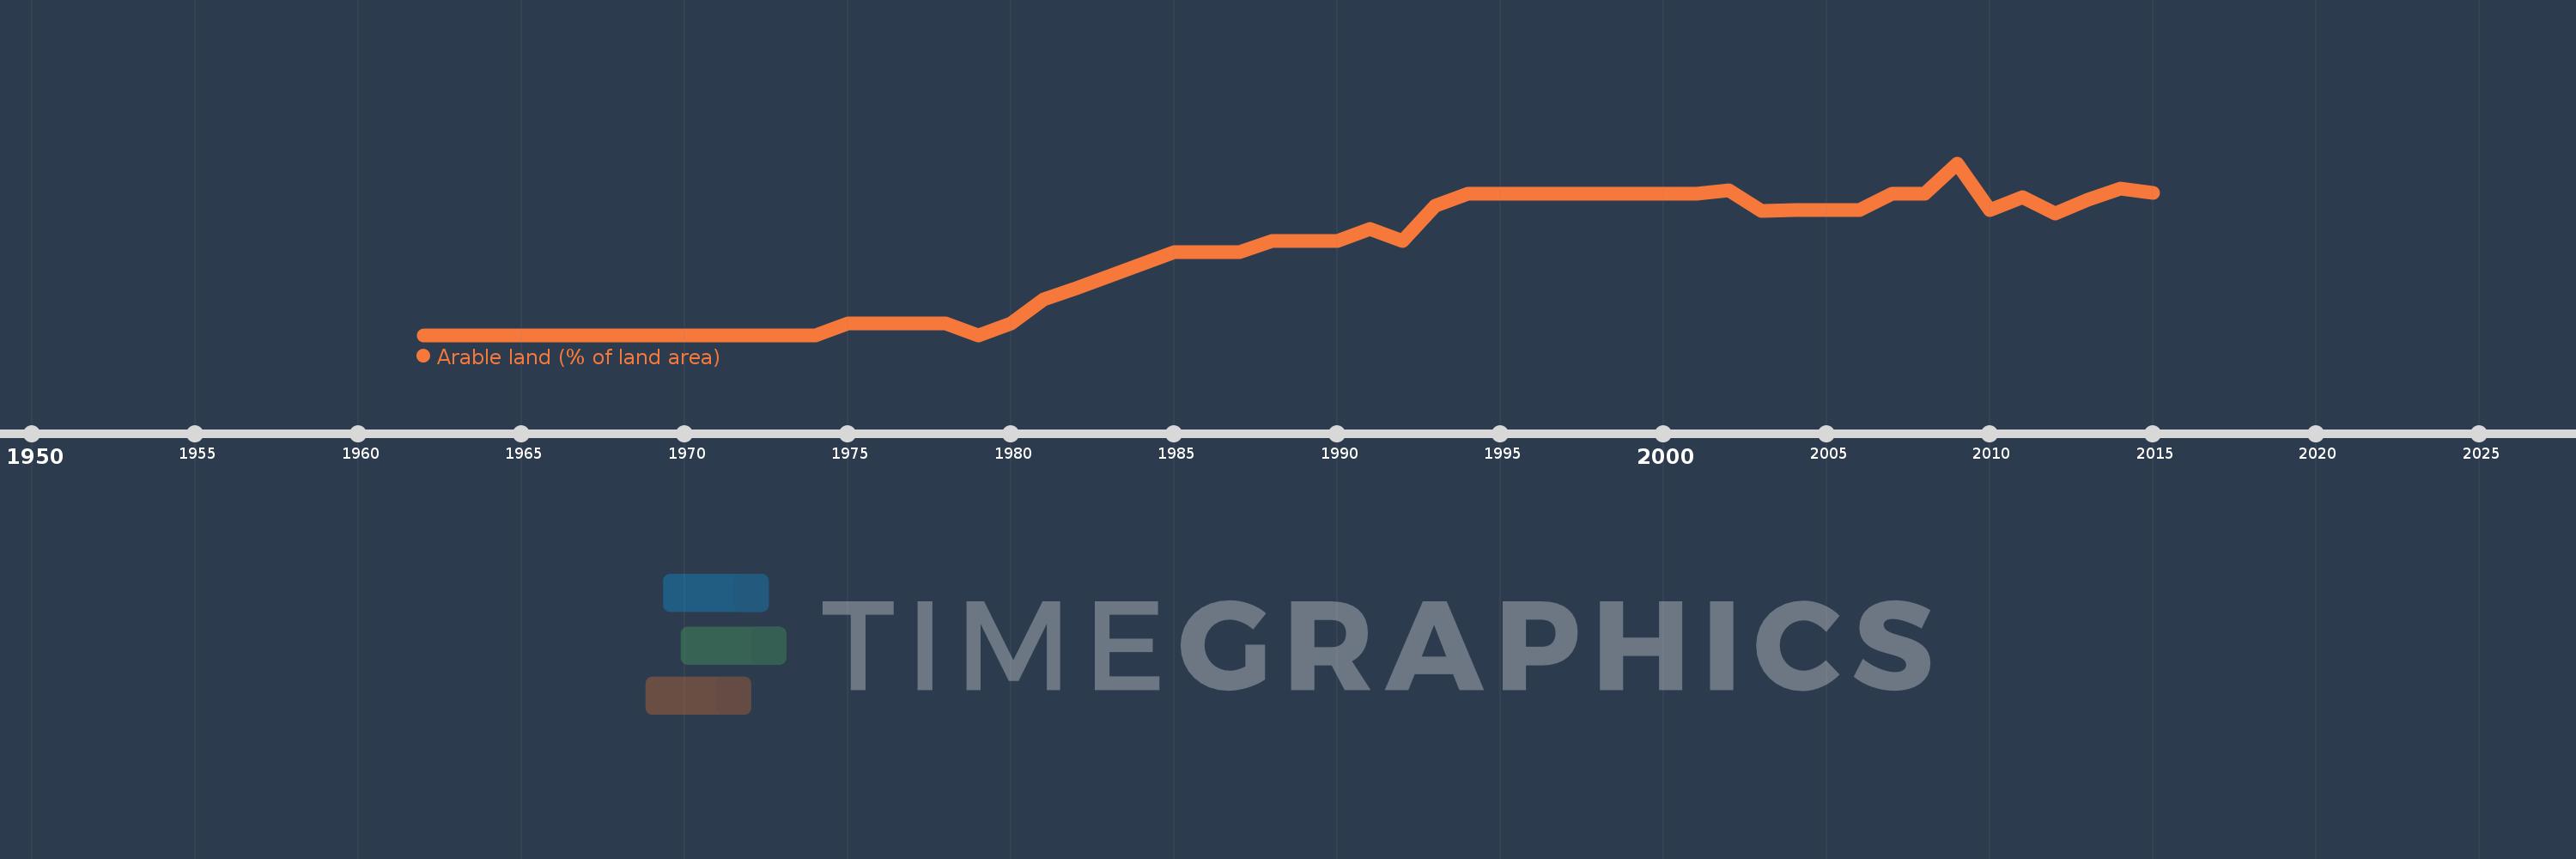
Arable land (% of land area)
2015,2014,2013,2012,2011,2010,2009,2008,2007,2006,2005,2004,2003,2002,2001,2000,1999,1998,1997,1996,1995,1994,1993,1992,1991,1990,1989,1988,1987,1986,1985,1984,1983,1982,1981,1980,1979,1978,1977,1976,1975,1974,1973,1972,1971,1970,1969,1968,1967,1966,1965,1964,1963,1962
This statistics in other country:
AfghanistanAlbaniaAlgeriaAmerican SamoaAndorraAngolaAntigua and BarbudaArab WorldArgentinaArmeniaArubaAustraliaAustriaAzerbaijanBahamas, TheBahrainBangladeshBarbadosBelarusBelgiumBelizeBeninBermudaBhutanBoliviaBosnia and HerzegovinaBotswanaBrazilBritish Virgin IslandsBrunei DarussalamBulgariaBurkina FasoBurundiCabo VerdeCambodiaCameroonCanadaCaribbean small statesCayman IslandsCentral African RepublicCentral Europe and the BalticsChadChannel IslandsChileChinaColombiaComorosCongo, Dem. Rep.Congo, Rep.Costa RicaCote d'IvoireCroatiaCubaCyprusCzech RepublicDenmarkDjiboutiDominicaDominican RepublicEarly-demographic dividendEast Asia & PacificEast Asia & Pacific (excluding high income)East Asia & Pacific (IDA & IBRD countries)EcuadorEgypt, Arab Rep.El SalvadorEquatorial GuineaEritreaEstoniaEthiopiaEuro areaEurope & Central AsiaEurope & Central Asia (excluding high income)Europe & Central Asia (IDA & IBRD countries)European UnionFaroe IslandsFijiFinlandFragile and conflict affected situationsFranceFrench PolynesiaGabonGambia, TheGeorgiaGermanyGhanaGreeceGreenlandGrenadaGuamGuatemalaGuineaGuinea-BissauGuyanaHaitiHeavily indebted poor countries (HIPC)High incomeHondurasHong Kong SAR, ChinaHungaryIBRD onlyIcelandIDA & IBRD totalIDA blendIDA onlyIDA totalIndiaIndonesiaIran, Islamic Rep.IraqIrelandIsle of ManIsraelItalyJamaicaJapanJordanKazakhstanKenyaKiribatiKorea, Dem. People’s Rep.Korea, Rep.KosovoKuwaitKyrgyz RepublicLao PDRLate-demographic dividendLatin America & Caribbean Latin America & Caribbean (excluding high income)Latin America & the Caribbean (IDA & IBRD countries)LatviaLeast developed countries: UN classificationLebanonLesothoLiberiaLibyaLiechtensteinLithuaniaLow & middle incomeLow incomeLower middle incomeLuxembourgMacedonia, FYRMadagascarMalawiMalaysiaMaldivesMaliMaltaMarshall IslandsMauritaniaMauritiusMexicoMicronesia, Fed. Sts.Middle East & North AfricaMiddle East & North Africa (excluding high income)Middle East & North Africa (IDA & IBRD countries)Middle incomeMoldovaMongoliaMontenegroMoroccoMozambiqueMyanmarNamibiaNepalNetherlandsNew CaledoniaNew ZealandNicaraguaNigerNigeriaNorth AmericaNorthern Mariana IslandsNorwayOECD membersOmanOther small statesPacific island small statesPakistanPalauPanamaPapua New GuineaParaguayPeruPhilippinesPolandPortugalPost-demographic dividendPre-demographic dividendPuerto RicoQatarRomaniaRussian FederationRwandaSamoaSan MarinoSao Tome and PrincipeSaudi ArabiaSenegalSerbiaSeychellesSierra LeoneSingaporeSlovak RepublicSloveniaSmall statesSolomon IslandsSomaliaSouth AfricaSouth AsiaSouth Asia (IDA & IBRD)SpainSri LankaSt. Kitts and NevisSt. LuciaSt. Vincent and the GrenadinesSub-Saharan Africa Sub-Saharan Africa (excluding high income)Sub-Saharan Africa (IDA & IBRD countries)SudanSurinameSwazilandSwedenSwitzerlandSyrian Arab RepublicTajikistanTanzaniaThailandTimor-LesteTogoTongaTrinidad and TobagoTunisiaTurkeyTurkmenistanTurks and Caicos IslandsUgandaUkraineUnited Arab EmiratesUnited KingdomUnited StatesUpper middle incomeUruguayUzbekistanVanuatuVenezuela, RBVietnamVirgin Islands (U.S.)West Bank and GazaWorldYemen, Rep.ZambiaZimbabwe Timeline:
This timeline shows a graph from 1962 to 2015 of Qatar. No data until 1961. Number of actual observations by date: 54.
Source name:
World Development Indicators
Source organization:
Food and Agriculture Organization, electronic files and web site.
Categories, topics:
Agriculture & Rural Development, Climate Change, Environment
Last updated:
apr 23, 2017
Indicators value changes by year
At the date of observation
Value
Absolute change
Change from previous value
jan 1, 1962
0.086
+0.086
0.0%
jan 1, 1963
0.086
0.0
0.0%
jan 1, 1964
0.086
0.0
0.0%
jan 1, 1965
0.086
0.0
0.0%
jan 1, 1966
0.086
0.0
0.0%
jan 1, 1967
0.086
0.0
0.0%
jan 1, 1968
0.086
0.0
0.0%
jan 1, 1969
0.086
0.0
0.0%
jan 1, 1970
0.086
0.0
0.0%
jan 1, 1971
0.086
0.0
0.0%
jan 1, 1972
0.086
0.0
0.0%
jan 1, 1973
0.086
0.0
0.0%
jan 1, 1974
0.086
0.0
0.0%
jan 1, 1975
0.172
+0.086
100.0%
jan 1, 1976
0.172
0.0
0.0%
jan 1, 1977
0.172
0.0
0.0%
jan 1, 1978
0.172
0.0
0.0%
jan 1, 1979
0.086
-0.086
-50.0%
jan 1, 1980
0.172
+0.086
100.0%
jan 1, 1981
0.345
+0.172
100.0%
jan 1, 1982
0.431
+0.086
25.0%
jan 1, 1983
0.517
+0.086
20.0%
jan 1, 1984
0.603
+0.086
16.67%
jan 1, 1985
0.689
+0.086
14.29%
jan 1, 1986
0.689
0.0
0.0%
jan 1, 1987
0.689
0.0
0.0%
jan 1, 1988
0.775
+0.086
12.5%
jan 1, 1989
0.775
0.0
0.0%
jan 1, 1990
0.775
0.0
0.0%
jan 1, 1991
0.861
+0.086
11.11%
jan 1, 1992
0.775
-0.086
-10.0%
jan 1, 1993
1.034
+0.258
33.33%
jan 1, 1994
1.12
+0.086
8.33%
jan 1, 2002
1.146
+0.026
2.31%
jan 1, 2003
0.991
-0.155
-13.53%
jan 1, 2004
0.999
+0.009
0.87%
jan 1, 2005
0.999
0.0
0.0%
jan 1, 2006
0.999
0.0
0.0%
jan 1, 2007
1.12
+0.121
12.07%
jan 1, 2009
1.342
+0.222
19.85%
jan 1, 2010
0.999
-0.343
-25.55%
jan 1, 2011
1.096
+0.097
9.74%
jan 1, 2012
0.974
-0.122
-11.15%
jan 1, 2013
1.075
+0.101
10.34%
jan 1, 2014
1.154
+0.079
7.37%
jan 1, 2015
1.128
-0.026
-2.24%
Ranking of countries by current statistics by years


Comments: