29
/
en
AIzaSyAYiBZKx7MnpbEhh9jyipgxe19OcubqV5w
April 1, 2024
173797
Lao PDR
LAO
true
2
1
Arable land (% of land area)
2015,2014,2013,2012,2011,2010,2009,2008,2007,2006,2005,2004,2003,2002,2001,2000,1999,1998,1997,1996,1995,1994,1993,1992,1991,1990,1989,1988,1987,1986,1985,1984,1983,1982,1981,1980,1979,1978,1977,1976,1975,1974,1973,1972,1971,1970,1969,1968,1967,1966,1965,1964,1963,1962
This statistics in other country:
AfghanistanAlbaniaAlgeriaAmerican SamoaAndorraAngolaAntigua and BarbudaArab WorldArgentinaArmeniaArubaAustraliaAustriaAzerbaijanBahamas, TheBahrainBangladeshBarbadosBelarusBelgiumBelizeBeninBermudaBhutanBoliviaBosnia and HerzegovinaBotswanaBrazilBritish Virgin IslandsBrunei DarussalamBulgariaBurkina FasoBurundiCabo VerdeCambodiaCameroonCanadaCaribbean small statesCayman IslandsCentral African RepublicCentral Europe and the BalticsChadChannel IslandsChileChinaColombiaComorosCongo, Dem. Rep.Congo, Rep.Costa RicaCote d'IvoireCroatiaCubaCyprusCzech RepublicDenmarkDjiboutiDominicaDominican RepublicEarly-demographic dividendEast Asia & PacificEast Asia & Pacific (excluding high income)East Asia & Pacific (IDA & IBRD countries)EcuadorEgypt, Arab Rep.El SalvadorEquatorial GuineaEritreaEstoniaEthiopiaEuro areaEurope & Central AsiaEurope & Central Asia (excluding high income)Europe & Central Asia (IDA & IBRD countries)European UnionFaroe IslandsFijiFinlandFragile and conflict affected situationsFranceFrench PolynesiaGabonGambia, TheGeorgiaGermanyGhanaGreeceGreenlandGrenadaGuamGuatemalaGuineaGuinea-BissauGuyanaHaitiHeavily indebted poor countries (HIPC)High incomeHondurasHong Kong SAR, ChinaHungaryIBRD onlyIcelandIDA & IBRD totalIDA blendIDA onlyIDA totalIndiaIndonesiaIran, Islamic Rep.IraqIrelandIsle of ManIsraelItalyJamaicaJapanJordanKazakhstanKenyaKiribatiKorea, Dem. People’s Rep.Korea, Rep.KosovoKuwaitKyrgyz RepublicLao PDRLate-demographic dividendLatin America & Caribbean Latin America & Caribbean (excluding high income)Latin America & the Caribbean (IDA & IBRD countries)LatviaLeast developed countries: UN classificationLebanonLesothoLiberiaLibyaLiechtensteinLithuaniaLow & middle incomeLow incomeLower middle incomeLuxembourgMacedonia, FYRMadagascarMalawiMalaysiaMaldivesMaliMaltaMarshall IslandsMauritaniaMauritiusMexicoMicronesia, Fed. Sts.Middle East & North AfricaMiddle East & North Africa (excluding high income)Middle East & North Africa (IDA & IBRD countries)Middle incomeMoldovaMongoliaMontenegroMoroccoMozambiqueMyanmarNamibiaNepalNetherlandsNew CaledoniaNew ZealandNicaraguaNigerNigeriaNorth AmericaNorthern Mariana IslandsNorwayOECD membersOmanOther small statesPacific island small statesPakistanPalauPanamaPapua New GuineaParaguayPeruPhilippinesPolandPortugalPost-demographic dividendPre-demographic dividendPuerto RicoQatarRomaniaRussian FederationRwandaSamoaSan MarinoSao Tome and PrincipeSaudi ArabiaSenegalSerbiaSeychellesSierra LeoneSingaporeSlovak RepublicSloveniaSmall statesSolomon IslandsSomaliaSouth AfricaSouth AsiaSouth Asia (IDA & IBRD)SpainSri LankaSt. Kitts and NevisSt. LuciaSt. Vincent and the GrenadinesSub-Saharan Africa Sub-Saharan Africa (excluding high income)Sub-Saharan Africa (IDA & IBRD countries)SudanSurinameSwazilandSwedenSwitzerlandSyrian Arab RepublicTajikistanTanzaniaThailandTimor-LesteTogoTongaTrinidad and TobagoTunisiaTurkeyTurkmenistanTurks and Caicos IslandsUgandaUkraineUnited Arab EmiratesUnited KingdomUnited StatesUpper middle incomeUruguayUzbekistanVanuatuVenezuela, RBVietnamVirgin Islands (U.S.)West Bank and GazaWorldYemen, Rep.ZambiaZimbabwe Timeline:
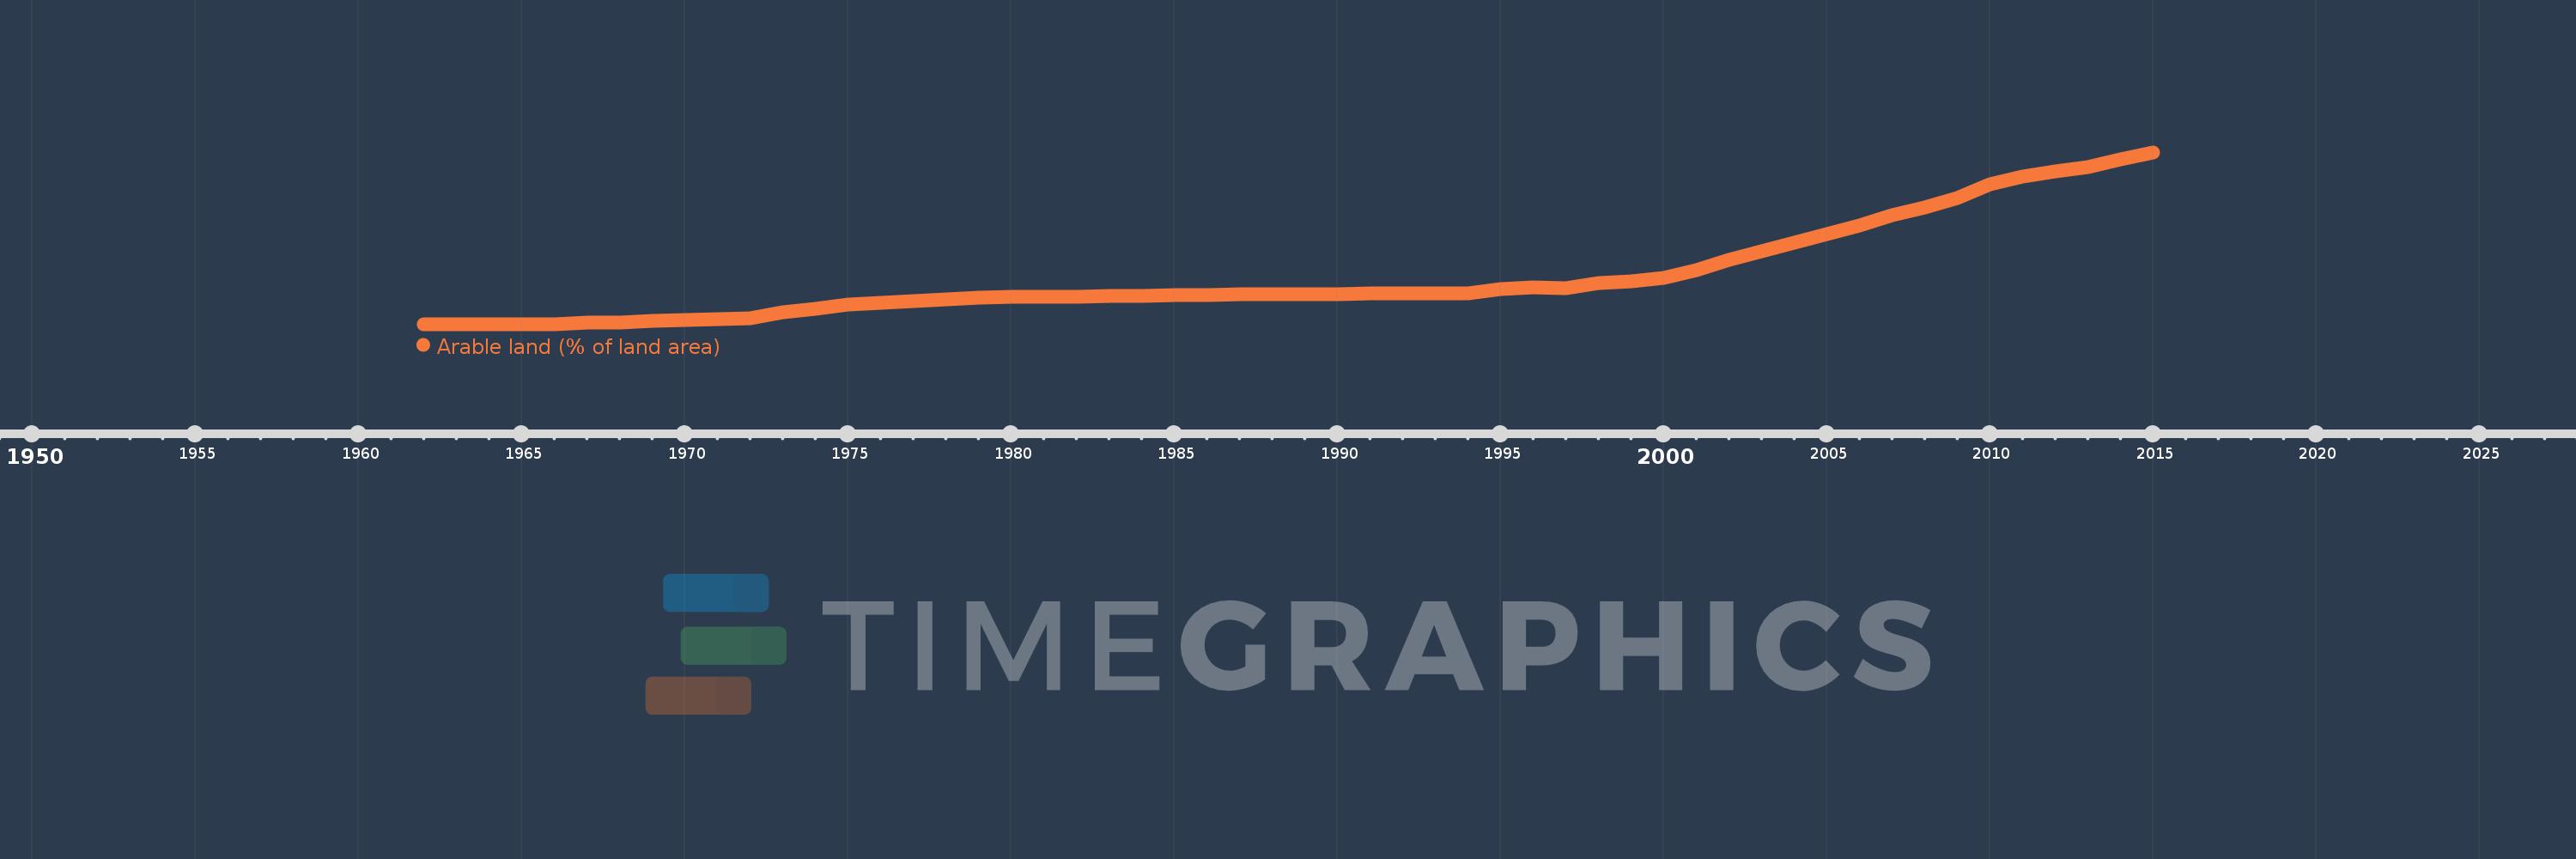
This timeline shows a graph from 1962 to 2015 of Lao PDR. No data until 1961. Number of actual observations by date: 54.
Source name:
World Development Indicators
Source organization:
Food and Agriculture Organization, electronic files and web site.
Categories, topics:
Agriculture & Rural Development, Climate Change, Environment
Last updated:
apr 23, 2017
Indicators value changes by year
At the date of observation
Value
Absolute change
Change from previous value
jan 1, 1962
2.773
+2.773
0.0%
jan 1, 1963
2.773
0.0
0.0%
jan 1, 1964
2.773
0.0
0.0%
jan 1, 1965
2.773
0.0
0.0%
jan 1, 1966
2.773
0.0
0.0%
jan 1, 1967
2.816
+0.043
1.56%
jan 1, 1968
2.816
0.0
0.0%
jan 1, 1969
2.851
+0.035
1.23%
jan 1, 1970
2.86
+0.009
0.3%
jan 1, 1971
2.881
+0.022
0.76%
jan 1, 1972
2.903
+0.022
0.75%
jan 1, 1973
3.033
+0.13
4.48%
jan 1, 1974
3.12
+0.087
2.86%
jan 1, 1975
3.206
+0.087
2.78%
jan 1, 1976
3.25
+0.043
1.35%
jan 1, 1977
3.293
+0.043
1.33%
jan 1, 1978
3.336
+0.043
1.32%
jan 1, 1979
3.358
+0.022
0.65%
jan 1, 1980
3.38
+0.022
0.65%
jan 1, 1983
3.401
+0.022
0.64%
jan 1, 1984
3.401
0.0
0.0%
jan 1, 1985
3.423
+0.022
0.64%
jan 1, 1986
3.432
+0.009
0.25%
jan 1, 1987
3.436
+0.004
0.13%
jan 1, 1988
3.436
0.0
0.0%
jan 1, 1989
3.445
+0.009
0.25%
jan 1, 1990
3.445
0.0
0.0%
jan 1, 1991
3.462
+0.017
0.5%
jan 1, 1992
3.462
0.0
0.0%
jan 1, 1993
3.462
0.0
0.0%
jan 1, 1994
3.462
0.0
0.0%
jan 1, 1995
3.562
+0.1
2.88%
jan 1, 1996
3.588
+0.026
0.73%
jan 1, 1997
3.57
-0.017
-0.48%
jan 1, 1998
3.7
+0.13
3.64%
jan 1, 1999
3.735
+0.035
0.94%
jan 1, 2000
3.8
+0.065
1.74%
jan 1, 2001
3.986
+0.186
4.9%
jan 1, 2002
4.203
+0.217
5.43%
jan 1, 2003
4.398
+0.195
4.64%
jan 1, 2004
4.593
+0.195
4.43%
jan 1, 2005
4.788
+0.195
4.25%
jan 1, 2006
4.983
+0.195
4.07%
jan 1, 2007
5.199
+0.217
4.35%
jan 1, 2008
5.373
+0.173
3.33%
jan 1, 2009
5.589
+0.217
4.03%
jan 1, 2010
5.893
+0.303
5.43%
jan 1, 2011
6.066
+0.173
2.94%
jan 1, 2012
6.187
+0.121
2.0%
jan 1, 2013
6.282
+0.095
1.54%
jan 1, 2014
6.451
+0.169
2.69%
jan 1, 2015
6.607
+0.156
2.42%
Ranking of countries by current statistics by years


Comments: