29
/
en
AIzaSyAYiBZKx7MnpbEhh9jyipgxe19OcubqV5w
April 1, 2024
94505
Burkina Faso
BFA
true
2
1
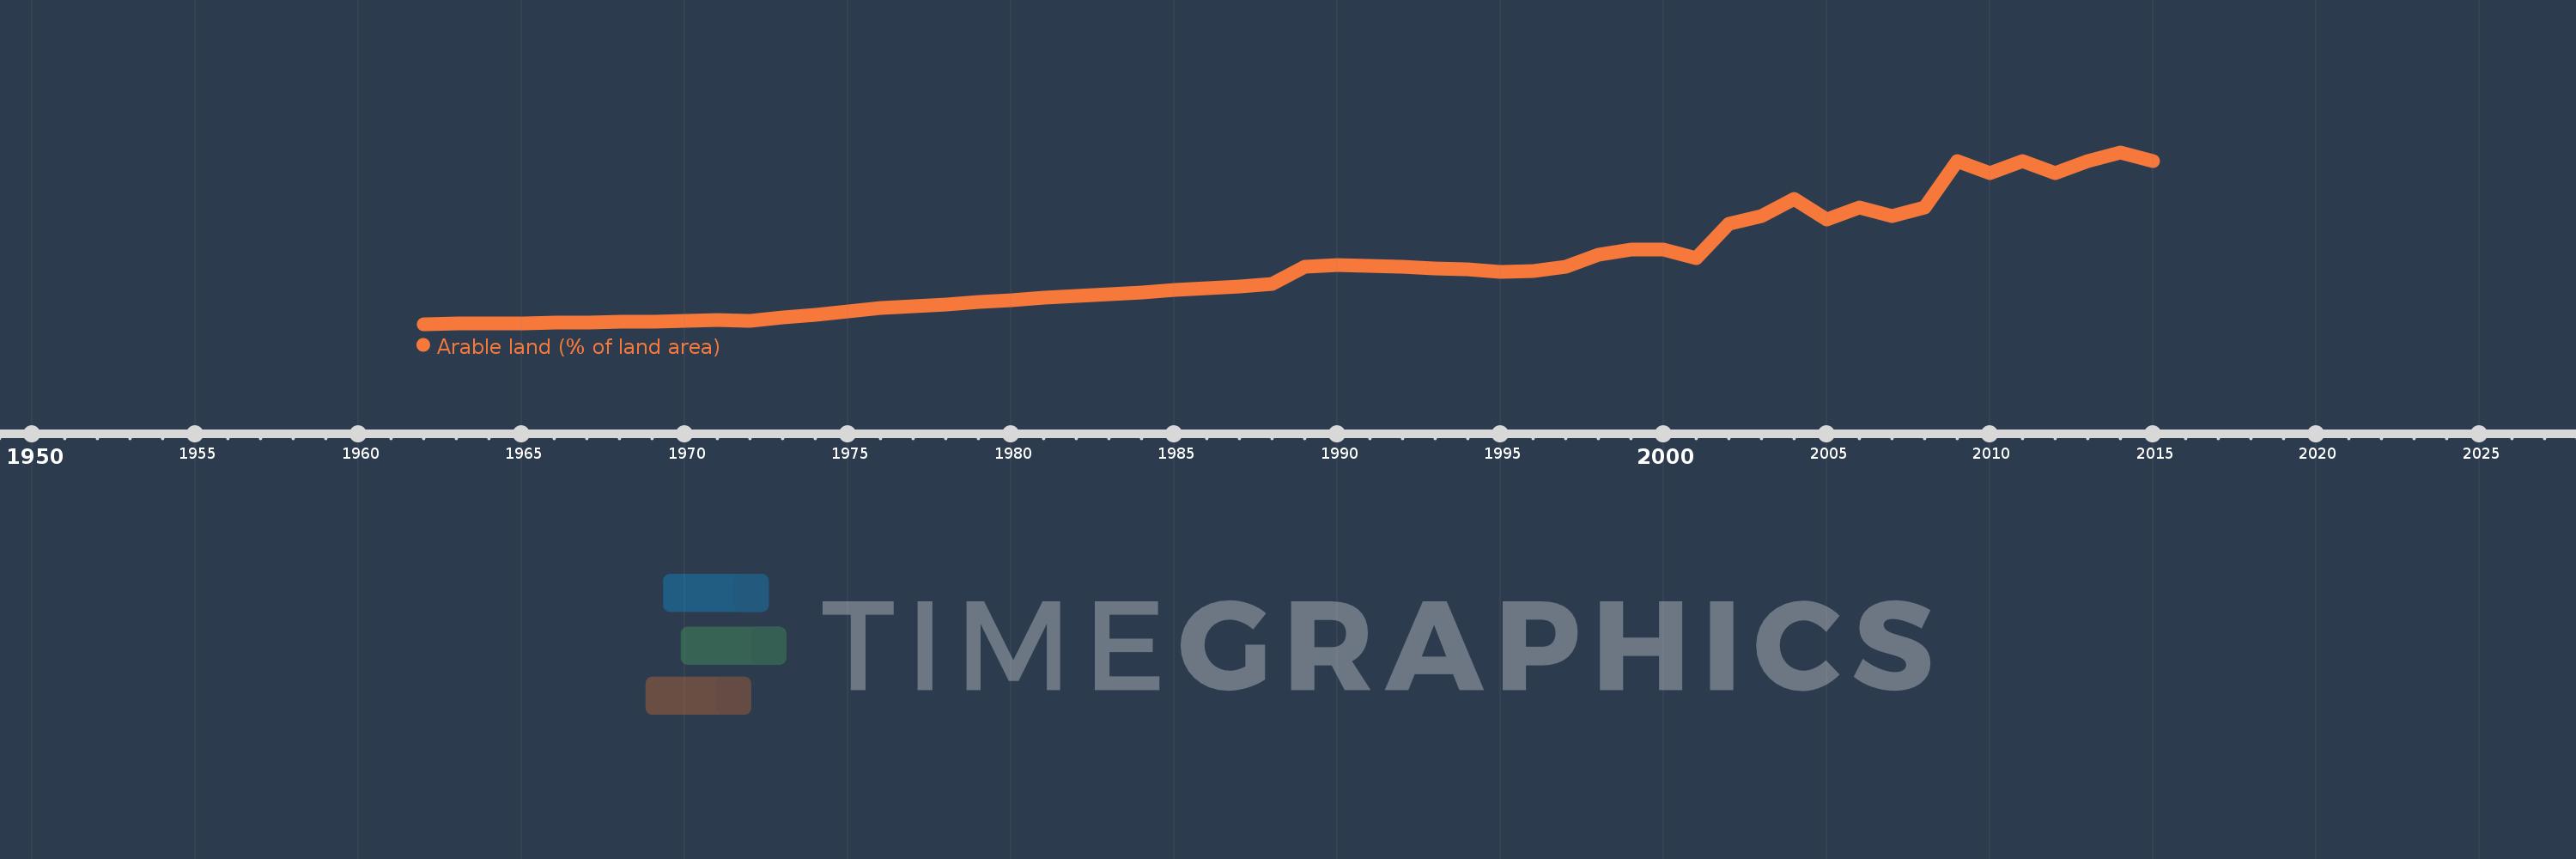
Arable land (% of land area)
2015,2014,2013,2012,2011,2010,2009,2008,2007,2006,2005,2004,2003,2002,2001,2000,1999,1998,1997,1996,1995,1994,1993,1992,1991,1990,1989,1988,1987,1986,1985,1984,1983,1982,1981,1980,1979,1978,1977,1976,1975,1974,1973,1972,1971,1970,1969,1968,1967,1966,1965,1964,1963,1962
This statistics in other country:
AfghanistanAlbaniaAlgeriaAmerican SamoaAndorraAngolaAntigua and BarbudaArab WorldArgentinaArmeniaArubaAustraliaAustriaAzerbaijanBahamas, TheBahrainBangladeshBarbadosBelarusBelgiumBelizeBeninBermudaBhutanBoliviaBosnia and HerzegovinaBotswanaBrazilBritish Virgin IslandsBrunei DarussalamBulgariaBurkina FasoBurundiCabo VerdeCambodiaCameroonCanadaCaribbean small statesCayman IslandsCentral African RepublicCentral Europe and the BalticsChadChannel IslandsChileChinaColombiaComorosCongo, Dem. Rep.Congo, Rep.Costa RicaCote d'IvoireCroatiaCubaCyprusCzech RepublicDenmarkDjiboutiDominicaDominican RepublicEarly-demographic dividendEast Asia & PacificEast Asia & Pacific (excluding high income)East Asia & Pacific (IDA & IBRD countries)EcuadorEgypt, Arab Rep.El SalvadorEquatorial GuineaEritreaEstoniaEthiopiaEuro areaEurope & Central AsiaEurope & Central Asia (excluding high income)Europe & Central Asia (IDA & IBRD countries)European UnionFaroe IslandsFijiFinlandFragile and conflict affected situationsFranceFrench PolynesiaGabonGambia, TheGeorgiaGermanyGhanaGreeceGreenlandGrenadaGuamGuatemalaGuineaGuinea-BissauGuyanaHaitiHeavily indebted poor countries (HIPC)High incomeHondurasHong Kong SAR, ChinaHungaryIBRD onlyIcelandIDA & IBRD totalIDA blendIDA onlyIDA totalIndiaIndonesiaIran, Islamic Rep.IraqIrelandIsle of ManIsraelItalyJamaicaJapanJordanKazakhstanKenyaKiribatiKorea, Dem. People’s Rep.Korea, Rep.KosovoKuwaitKyrgyz RepublicLao PDRLate-demographic dividendLatin America & Caribbean Latin America & Caribbean (excluding high income)Latin America & the Caribbean (IDA & IBRD countries)LatviaLeast developed countries: UN classificationLebanonLesothoLiberiaLibyaLiechtensteinLithuaniaLow & middle incomeLow incomeLower middle incomeLuxembourgMacedonia, FYRMadagascarMalawiMalaysiaMaldivesMaliMaltaMarshall IslandsMauritaniaMauritiusMexicoMicronesia, Fed. Sts.Middle East & North AfricaMiddle East & North Africa (excluding high income)Middle East & North Africa (IDA & IBRD countries)Middle incomeMoldovaMongoliaMontenegroMoroccoMozambiqueMyanmarNamibiaNepalNetherlandsNew CaledoniaNew ZealandNicaraguaNigerNigeriaNorth AmericaNorthern Mariana IslandsNorwayOECD membersOmanOther small statesPacific island small statesPakistanPalauPanamaPapua New GuineaParaguayPeruPhilippinesPolandPortugalPost-demographic dividendPre-demographic dividendPuerto RicoQatarRomaniaRussian FederationRwandaSamoaSan MarinoSao Tome and PrincipeSaudi ArabiaSenegalSerbiaSeychellesSierra LeoneSingaporeSlovak RepublicSloveniaSmall statesSolomon IslandsSomaliaSouth AfricaSouth AsiaSouth Asia (IDA & IBRD)SpainSri LankaSt. Kitts and NevisSt. LuciaSt. Vincent and the GrenadinesSub-Saharan Africa Sub-Saharan Africa (excluding high income)Sub-Saharan Africa (IDA & IBRD countries)SudanSurinameSwazilandSwedenSwitzerlandSyrian Arab RepublicTajikistanTanzaniaThailandTimor-LesteTogoTongaTrinidad and TobagoTunisiaTurkeyTurkmenistanTurks and Caicos IslandsUgandaUkraineUnited Arab EmiratesUnited KingdomUnited StatesUpper middle incomeUruguayUzbekistanVanuatuVenezuela, RBVietnamVirgin Islands (U.S.)West Bank and GazaWorldYemen, Rep.ZambiaZimbabwe Timeline:
This timeline shows a graph from 1962 to 2015 of Burkina Faso. No data until 1961. Number of actual observations by date: 54.
Source name:
World Development Indicators
Source organization:
Food and Agriculture Organization, electronic files and web site.
Categories, topics:
Agriculture & Rural Development, Climate Change, Environment
Last updated:
apr 23, 2017
Indicators value changes by year
Maximum:
22.661
jan 1, 2014
At the date of observation
Value
Absolute change
Change from previous value
jan 1, 1962
7.763
+7.763
0.0%
jan 1, 1963
7.8
+0.037
0.47%
jan 1, 1964
7.836
+0.037
0.47%
jan 1, 1965
7.855
+0.018
0.23%
jan 1, 1966
7.891
+0.037
0.47%
jan 1, 1967
7.931
+0.04
0.51%
jan 1, 1968
7.968
+0.037
0.46%
jan 1, 1969
8.004
+0.037
0.46%
jan 1, 1970
8.048
+0.044
0.55%
jan 1, 1971
8.099
+0.051
0.64%
jan 1, 1972
8.041
-0.058
-0.72%
jan 1, 1973
8.341
+0.3
3.73%
jan 1, 1974
8.6
+0.26
3.11%
jan 1, 1975
8.893
+0.292
3.4%
jan 1, 1976
9.159
+0.267
3.0%
jan 1, 1977
9.32
+0.161
1.76%
jan 1, 1978
9.503
+0.183
1.96%
jan 1, 1979
9.686
+0.183
1.92%
jan 1, 1980
9.868
+0.183
1.89%
jan 1, 1981
10.033
+0.164
1.67%
jan 1, 1982
10.197
+0.164
1.64%
jan 1, 1983
10.38
+0.183
1.79%
jan 1, 1984
10.545
+0.164
1.58%
jan 1, 1985
10.709
+0.164
1.56%
jan 1, 1986
10.892
+0.183
1.71%
jan 1, 1987
11.056
+0.164
1.51%
jan 1, 1988
11.239
+0.183
1.65%
jan 1, 1989
12.77
+1.531
13.63%
jan 1, 1990
12.902
+0.132
1.03%
jan 1, 1991
12.811
-0.091
-0.71%
jan 1, 1992
12.719
-0.091
-0.71%
jan 1, 1993
12.628
-0.091
-0.72%
jan 1, 1994
12.537
-0.091
-0.72%
jan 1, 1995
12.284
-0.252
-2.01%
jan 1, 1996
12.354
+0.069
0.57%
jan 1, 1997
12.719
+0.365
2.96%
jan 1, 1998
13.816
+1.096
8.62%
jan 1, 1999
14.254
+0.439
3.17%
jan 1, 2000
14.254
0.0
0.0%
jan 1, 2001
13.523
-0.731
-5.13%
jan 1, 2002
16.447
+2.924
21.62%
jan 1, 2003
17.178
+0.731
4.44%
jan 1, 2004
18.64
+1.462
8.51%
jan 1, 2005
16.813
-1.827
-9.8%
jan 1, 2006
17.909
+1.096
6.52%
jan 1, 2007
17.178
-0.731
-4.08%
jan 1, 2008
17.909
+0.731
4.26%
jan 1, 2009
21.93
+4.02
22.45%
jan 1, 2010
20.833
-1.096
-5.0%
jan 1, 2011
21.93
+1.096
5.26%
jan 1, 2012
20.833
-1.096
-5.0%
jan 1, 2013
21.93
+1.096
5.26%
jan 1, 2014
22.661
+0.731
3.33%
jan 1, 2015
21.93
-0.731
-3.23%
Ranking of countries by current statistics by years


Comments: