29
/
en
AIzaSyAYiBZKx7MnpbEhh9jyipgxe19OcubqV5w
April 1, 2024
267494
Trinidad and Tobago
TTO
true
2
1
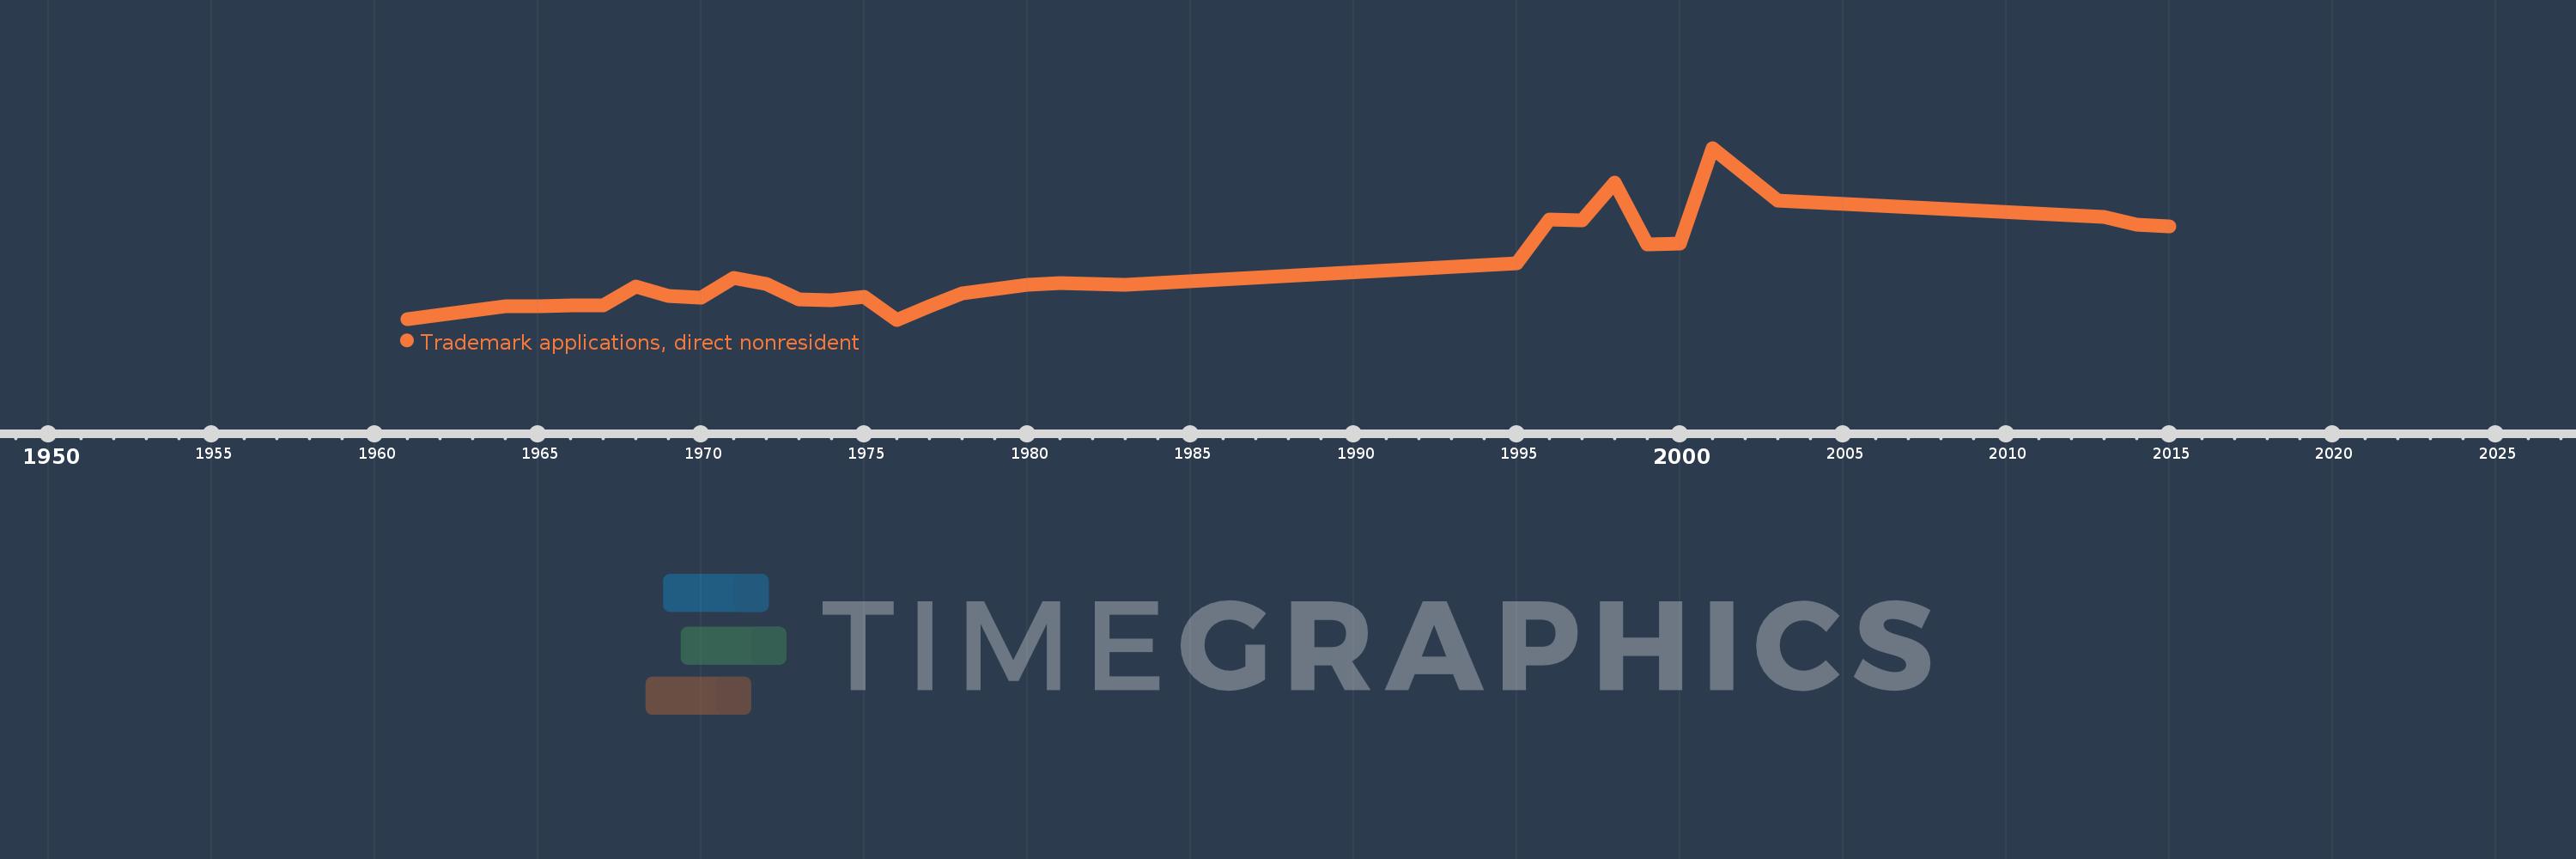
Trademark applications, direct nonresident
2015,2014,2013,2003,2001,2000,1999,1998,1997,1996,1995,1983,1981,1980,1979,1978,1977,1976,1975,1974,1973,1972,1971,1970,1969,1968,1967,1966,1965,1964,1962,1961
This statistics in other country:
AlbaniaAlgeriaAndorraAngolaAntigua and BarbudaArab WorldArgentinaArmeniaArubaAustraliaAustriaAzerbaijanBahamas, TheBahrainBangladeshBarbadosBelarusBelgiumBelizeBhutanBoliviaBosnia and HerzegovinaBotswanaBrazilBrunei DarussalamBulgariaBurundiCambodiaCanadaCaribbean small statesCentral Europe and the BalticsChileChinaColombiaCongo, Dem. Rep.Costa RicaCroatiaCubaCuracaoCyprusCzech RepublicDenmarkDjiboutiDominicaDominican RepublicEarly-demographic dividendEast Asia & PacificEast Asia & Pacific (excluding high income)East Asia & Pacific (IDA & IBRD countries)EcuadorEgypt, Arab Rep.El SalvadorEstoniaEthiopiaEuro areaEurope & Central AsiaEurope & Central Asia (excluding high income)Europe & Central Asia (IDA & IBRD countries)European UnionFijiFinlandFranceGambia, TheGeorgiaGermanyGhanaGreeceGrenadaGuatemalaGuyanaHaitiHigh incomeHondurasHong Kong SAR, ChinaHungaryIBRD onlyIcelandIDA & IBRD totalIDA blendIndiaIndonesiaIran, Islamic Rep.IraqIrelandIsraelItalyJamaicaJapanJordanKazakhstanKenyaKiribatiKorea, Dem. People’s Rep.Korea, Rep.KuwaitKyrgyz RepublicLao PDRLate-demographic dividendLatin America & Caribbean Latin America & Caribbean (excluding high income)Latin America & the Caribbean (IDA & IBRD countries)LatviaLebanonLesothoLiberiaLibyaLiechtensteinLithuaniaLow & middle incomeLower middle incomeLuxembourgMacao SAR, ChinaMacedonia, FYRMadagascarMalawiMalaysiaMaliMaltaMauritiusMexicoMiddle East & North AfricaMiddle East & North Africa (excluding high income)Middle East & North Africa (IDA & IBRD countries)Middle incomeMoldovaMonacoMongoliaMontenegroMoroccoMozambiqueMyanmarNamibiaNepalNetherlandsNew ZealandNicaraguaNigeriaNorth AmericaNorwayOECD membersOmanOther small statesPacific island small statesPakistanPanamaPapua New GuineaParaguayPeruPhilippinesPolandPortugalPost-demographic dividendQatarRomaniaRussian FederationRwandaSamoaSan MarinoSao Tome and PrincipeSaudi ArabiaSerbiaSeychellesSierra LeoneSingaporeSint Maarten (Dutch part)Slovak RepublicSloveniaSmall statesSolomon IslandsSomaliaSouth AfricaSouth AsiaSouth Asia (IDA & IBRD)SpainSri LankaSt. LuciaSt. Vincent and the GrenadinesSudanSurinameSwazilandSwedenSwitzerlandSyrian Arab RepublicTajikistanTanzaniaThailandTongaTrinidad and TobagoTunisiaTurkeyTurkmenistanTuvaluUgandaUkraineUnited Arab EmiratesUnited KingdomUnited StatesUpper middle incomeUruguayUzbekistanVenezuela, RBVietnamWorldYemen, Rep.ZambiaZimbabwe Timeline:
This timeline shows a graph from 1961 to 2015 of Trinidad and Tobago. No data until 1960. Number of actual observations by date: 32.
Source name:
World Development Indicators
Source organization:
World Intellectual Property Organization (WIPO), WIPO Patent Report: Statistics on Worldwide Patent Activity. The International Bureau of WIPO assumes no responsibility with respect to the transformation of these data.
Categories, topics:
Science & Technology
Last updated:
apr 23, 2017
Indicators value changes by year
Maximum:
1.754K
jan 1, 2001
At the date of observation
Value
Absolute change
Change from previous value
jan 1, 1961
339.0
+339.0
0.0%
jan 1, 1962
373.0
+34.0
10.03%
jan 1, 1964
444.0
+71.0
19.03%
jan 1, 1965
443.0
-1.0
-0.23%
jan 1, 1966
456.0
+13.0
2.93%
jan 1, 1967
455.0
-1.0
-0.22%
jan 1, 1968
609.0
+154.0
33.85%
jan 1, 1969
534.0
-75.0
-12.32%
jan 1, 1970
517.0
-17.0
-3.18%
jan 1, 1971
677.0
+160.0
30.95%
jan 1, 1972
630.0
-47.0
-6.94%
jan 1, 1973
503.0
-127.0
-20.16%
jan 1, 1974
493.0
-10.0
-1.99%
jan 1, 1975
521.0
+28.0
5.68%
jan 1, 1976
334.0
-187.0
-35.89%
jan 1, 1977
443.0
+109.0
32.63%
jan 1, 1978
550.0
+107.0
24.15%
jan 1, 1979
589.0
+39.0
7.09%
jan 1, 1980
621.0
+32.0
5.43%
jan 1, 1981
640.0
+19.0
3.06%
jan 1, 1983
621.0
-19.0
-2.97%
jan 1, 1995
804.0
+183.0
29.47%
jan 1, 1996
1.164K
+360.0
44.78%
jan 1, 1997
1.155K
-9.0
-0.77%
jan 1, 1998
1.466K
+311.0
26.93%
jan 1, 1999
956.0
-510.0
-34.79%
jan 1, 2000
967.0
+11.0
1.15%
jan 1, 2001
1.754K
+787.0
81.39%
jan 1, 2003
1.317K
-437.0
-24.91%
jan 1, 2013
1.182K
-135.0
-10.25%
jan 1, 2014
1.118K
-64.0
-5.41%
jan 1, 2015
1.106K
-12.0
-1.07%
Ranking of countries by current statistics by years


Comments: