29
/
en
AIzaSyAYiBZKx7MnpbEhh9jyipgxe19OcubqV5w
April 1, 2024
248146
Spain
ESP
true
2
1
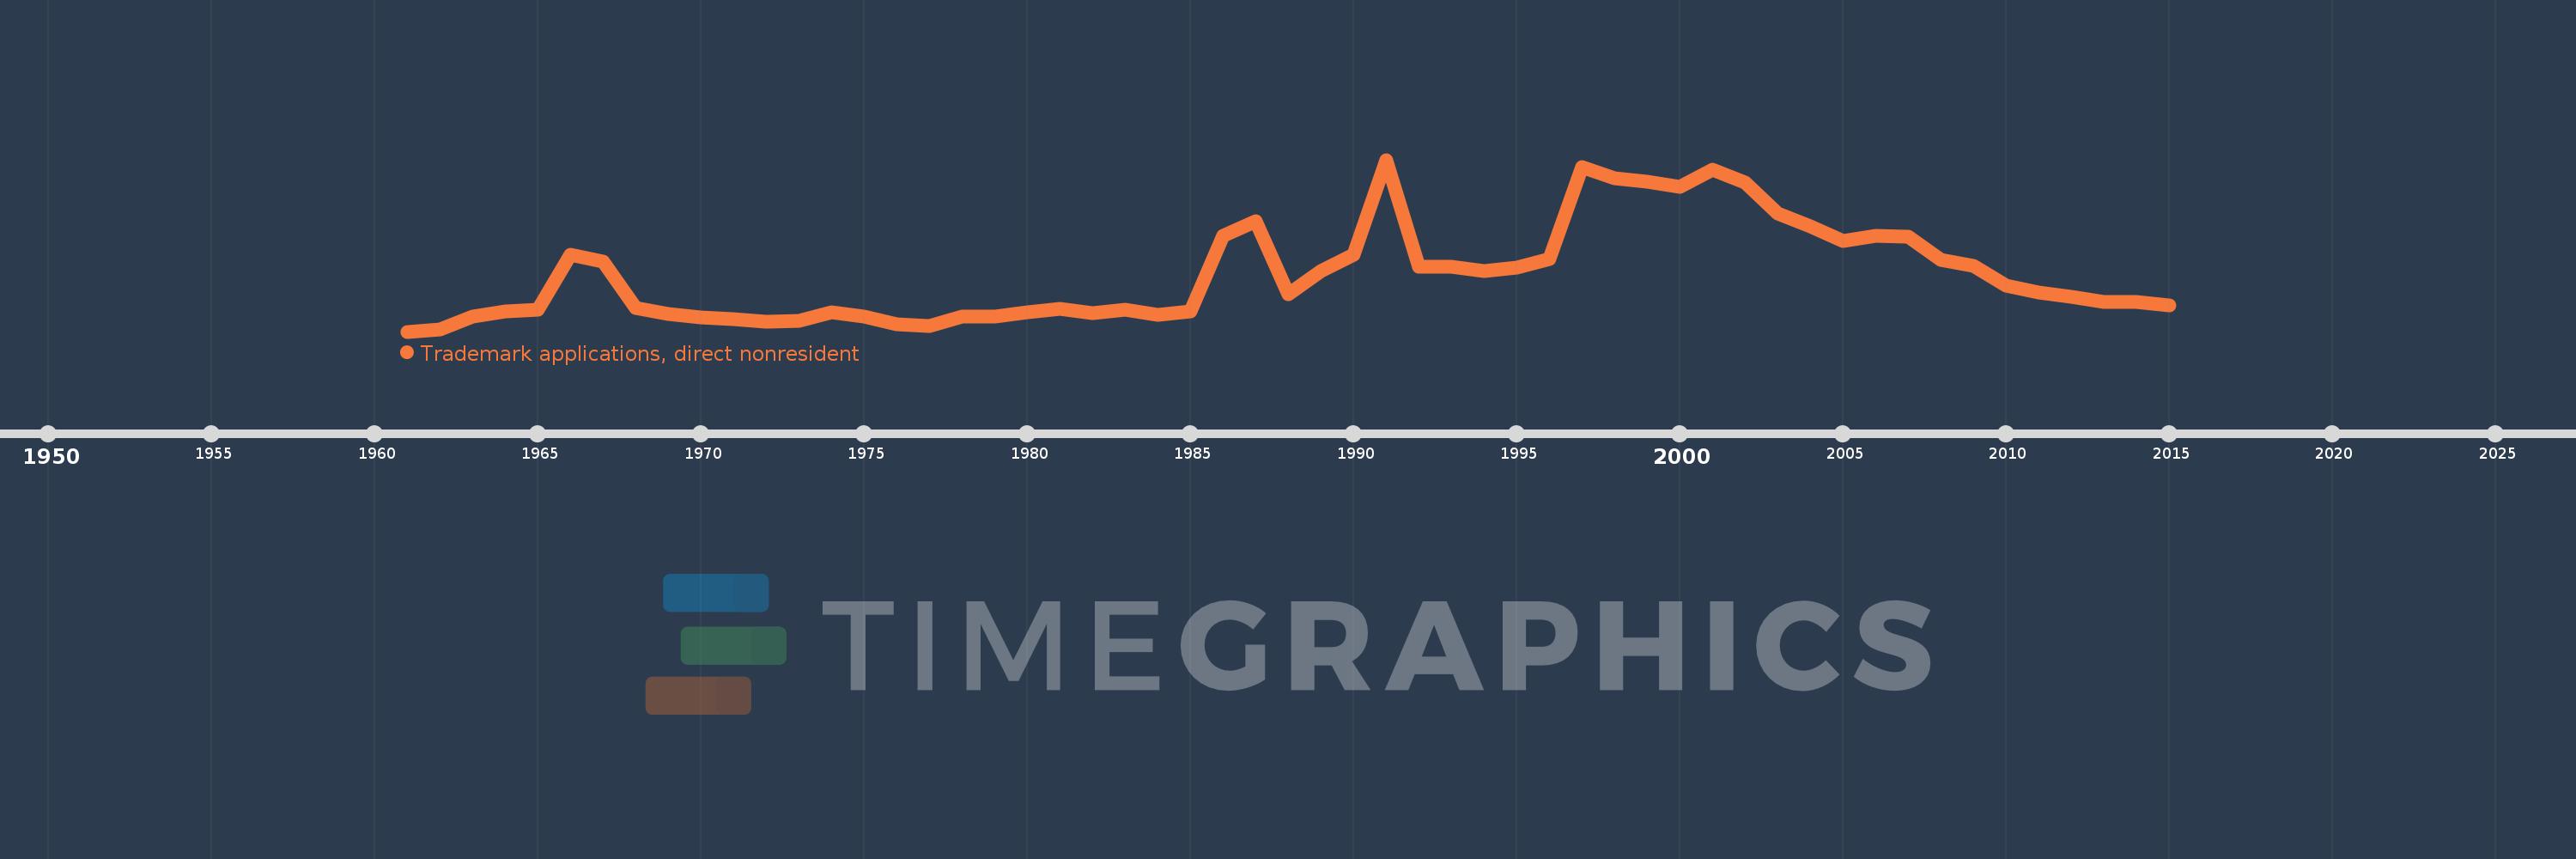
Trademark applications, direct nonresident
2015,2014,2013,2012,2011,2010,2009,2008,2007,2006,2005,2004,2003,2002,2001,2000,1999,1998,1997,1996,1995,1994,1993,1992,1991,1990,1989,1988,1987,1986,1985,1984,1983,1982,1981,1980,1979,1978,1977,1976,1975,1974,1973,1972,1971,1970,1969,1968,1967,1966,1965,1964,1963,1962,1961
This statistics in other country:
AlbaniaAlgeriaAndorraAngolaAntigua and BarbudaArab WorldArgentinaArmeniaArubaAustraliaAustriaAzerbaijanBahamas, TheBahrainBangladeshBarbadosBelarusBelgiumBelizeBhutanBoliviaBosnia and HerzegovinaBotswanaBrazilBrunei DarussalamBulgariaBurundiCambodiaCanadaCaribbean small statesCentral Europe and the BalticsChileChinaColombiaCongo, Dem. Rep.Costa RicaCroatiaCubaCuracaoCyprusCzech RepublicDenmarkDjiboutiDominicaDominican RepublicEarly-demographic dividendEast Asia & PacificEast Asia & Pacific (excluding high income)East Asia & Pacific (IDA & IBRD countries)EcuadorEgypt, Arab Rep.El SalvadorEstoniaEthiopiaEuro areaEurope & Central AsiaEurope & Central Asia (excluding high income)Europe & Central Asia (IDA & IBRD countries)European UnionFijiFinlandFranceGambia, TheGeorgiaGermanyGhanaGreeceGrenadaGuatemalaGuyanaHaitiHigh incomeHondurasHong Kong SAR, ChinaHungaryIBRD onlyIcelandIDA & IBRD totalIDA blendIndiaIndonesiaIran, Islamic Rep.IraqIrelandIsraelItalyJamaicaJapanJordanKazakhstanKenyaKiribatiKorea, Dem. People’s Rep.Korea, Rep.KuwaitKyrgyz RepublicLao PDRLate-demographic dividendLatin America & Caribbean Latin America & Caribbean (excluding high income)Latin America & the Caribbean (IDA & IBRD countries)LatviaLebanonLesothoLiberiaLibyaLiechtensteinLithuaniaLow & middle incomeLower middle incomeLuxembourgMacao SAR, ChinaMacedonia, FYRMadagascarMalawiMalaysiaMaliMaltaMauritiusMexicoMiddle East & North AfricaMiddle East & North Africa (excluding high income)Middle East & North Africa (IDA & IBRD countries)Middle incomeMoldovaMonacoMongoliaMontenegroMoroccoMozambiqueMyanmarNamibiaNepalNetherlandsNew ZealandNicaraguaNigeriaNorth AmericaNorwayOECD membersOmanOther small statesPacific island small statesPakistanPanamaPapua New GuineaParaguayPeruPhilippinesPolandPortugalPost-demographic dividendQatarRomaniaRussian FederationRwandaSamoaSan MarinoSao Tome and PrincipeSaudi ArabiaSerbiaSeychellesSierra LeoneSingaporeSint Maarten (Dutch part)Slovak RepublicSloveniaSmall statesSolomon IslandsSomaliaSouth AfricaSouth AsiaSouth Asia (IDA & IBRD)SpainSri LankaSt. LuciaSt. Vincent and the GrenadinesSudanSurinameSwazilandSwedenSwitzerlandSyrian Arab RepublicTajikistanTanzaniaThailandTongaTrinidad and TobagoTunisiaTurkeyTurkmenistanTuvaluUgandaUkraineUnited Arab EmiratesUnited KingdomUnited StatesUpper middle incomeUruguayUzbekistanVenezuela, RBVietnamWorldYemen, Rep.ZambiaZimbabwe Timeline:
This timeline shows a graph from 1961 to 2015 of Spain. No data until 1960. Number of actual observations by date: 55.
Source name:
World Development Indicators
Source organization:
World Intellectual Property Organization (WIPO), WIPO Patent Report: Statistics on Worldwide Patent Activity. The International Bureau of WIPO assumes no responsibility with respect to the transformation of these data.
Categories, topics:
Science & Technology
Last updated:
apr 23, 2017
Indicators value changes by year
Minimum:
1.726K
jan 1, 1961
Maximum:
17.361K
jan 1, 1991
At the date of observation
Value
Absolute change
Change from previous value
jan 1, 1961
1.726K
+1.726K
0.0%
jan 1, 1962
1.95K
+224.0
12.98%
jan 1, 1963
3.125K
+1.175K
60.26%
jan 1, 1964
3.536K
+411.0
13.15%
jan 1, 1965
3.703K
+167.0
4.72%
jan 1, 1966
8.749K
+5.046K
136.27%
jan 1, 1967
8.134K
-615.0
-7.03%
jan 1, 1968
3.912K
-4.222K
-51.91%
jan 1, 1969
3.3K
-612.0
-15.64%
jan 1, 1970
3.035K
-265.0
-8.03%
jan 1, 1971
2.828K
-207.0
-6.82%
jan 1, 1972
2.635K
-193.0
-6.82%
jan 1, 1973
2.727K
+92.0
3.49%
jan 1, 1974
3.469K
+742.0
27.21%
jan 1, 1975
3.117K
-352.0
-10.15%
jan 1, 1976
2.422K
-695.0
-22.3%
jan 1, 1977
2.231K
-191.0
-7.89%
jan 1, 1978
3.059K
+828.0
37.11%
jan 1, 1979
3.056K
-3.0
-0.1%
jan 1, 1980
3.447K
+391.0
12.79%
jan 1, 1981
3.798K
+351.0
10.18%
jan 1, 1982
3.387K
-411.0
-10.82%
jan 1, 1983
3.74K
+353.0
10.42%
jan 1, 1984
3.261K
-479.0
-12.81%
jan 1, 1985
3.544K
+283.0
8.68%
jan 1, 1986
10.465K
+6.921K
195.29%
jan 1, 1987
11.769K
+1.304K
12.46%
jan 1, 1988
5.153K
-6.616K
-56.22%
jan 1, 1989
7.254K
+2.101K
40.77%
jan 1, 1990
8.735K
+1.481K
20.42%
jan 1, 1991
17.361K
+8.626K
98.75%
jan 1, 1992
7.628K
-9.733K
-56.06%
jan 1, 1993
7.631K
+3.0
0.04%
jan 1, 1994
7.264K
-367.0
-4.81%
jan 1, 1995
7.547K
+283.0
3.9%
jan 1, 1996
8.307K
+760.0
10.07%
jan 1, 1997
16.693K
+8.386K
100.95%
jan 1, 1998
15.649K
-1.044K
-6.25%
jan 1, 1999
15.4K
-249.0
-1.59%
jan 1, 2000
14.918K
-482.0
-3.13%
jan 1, 2001
16.444K
+1.526K
10.23%
jan 1, 2002
15.263K
-1.181K
-7.18%
jan 1, 2003
12.46K
-2.803K
-18.36%
jan 1, 2004
11.274K
-1.186K
-9.52%
jan 1, 2005
9.987K
-1.287K
-11.42%
jan 1, 2006
10.431K
+444.0
4.45%
jan 1, 2007
10.328K
-103.0
-0.99%
jan 1, 2008
8.227K
-2.101K
-20.34%
jan 1, 2009
7.736K
-491.0
-5.97%
jan 1, 2010
5.885K
-1.851K
-23.93%
jan 1, 2011
5.305K
-580.0
-9.86%
jan 1, 2012
4.929K
-376.0
-7.09%
jan 1, 2013
4.397K
-532.0
-10.79%
jan 1, 2014
4.448K
+51.0
1.16%
jan 1, 2015
4.122K
-326.0
-7.33%
Ranking of countries by current statistics by years


Comments: