29
/
en
AIzaSyAYiBZKx7MnpbEhh9jyipgxe19OcubqV5w
April 1, 2024
30364
Euro area
EMU
false
2
1
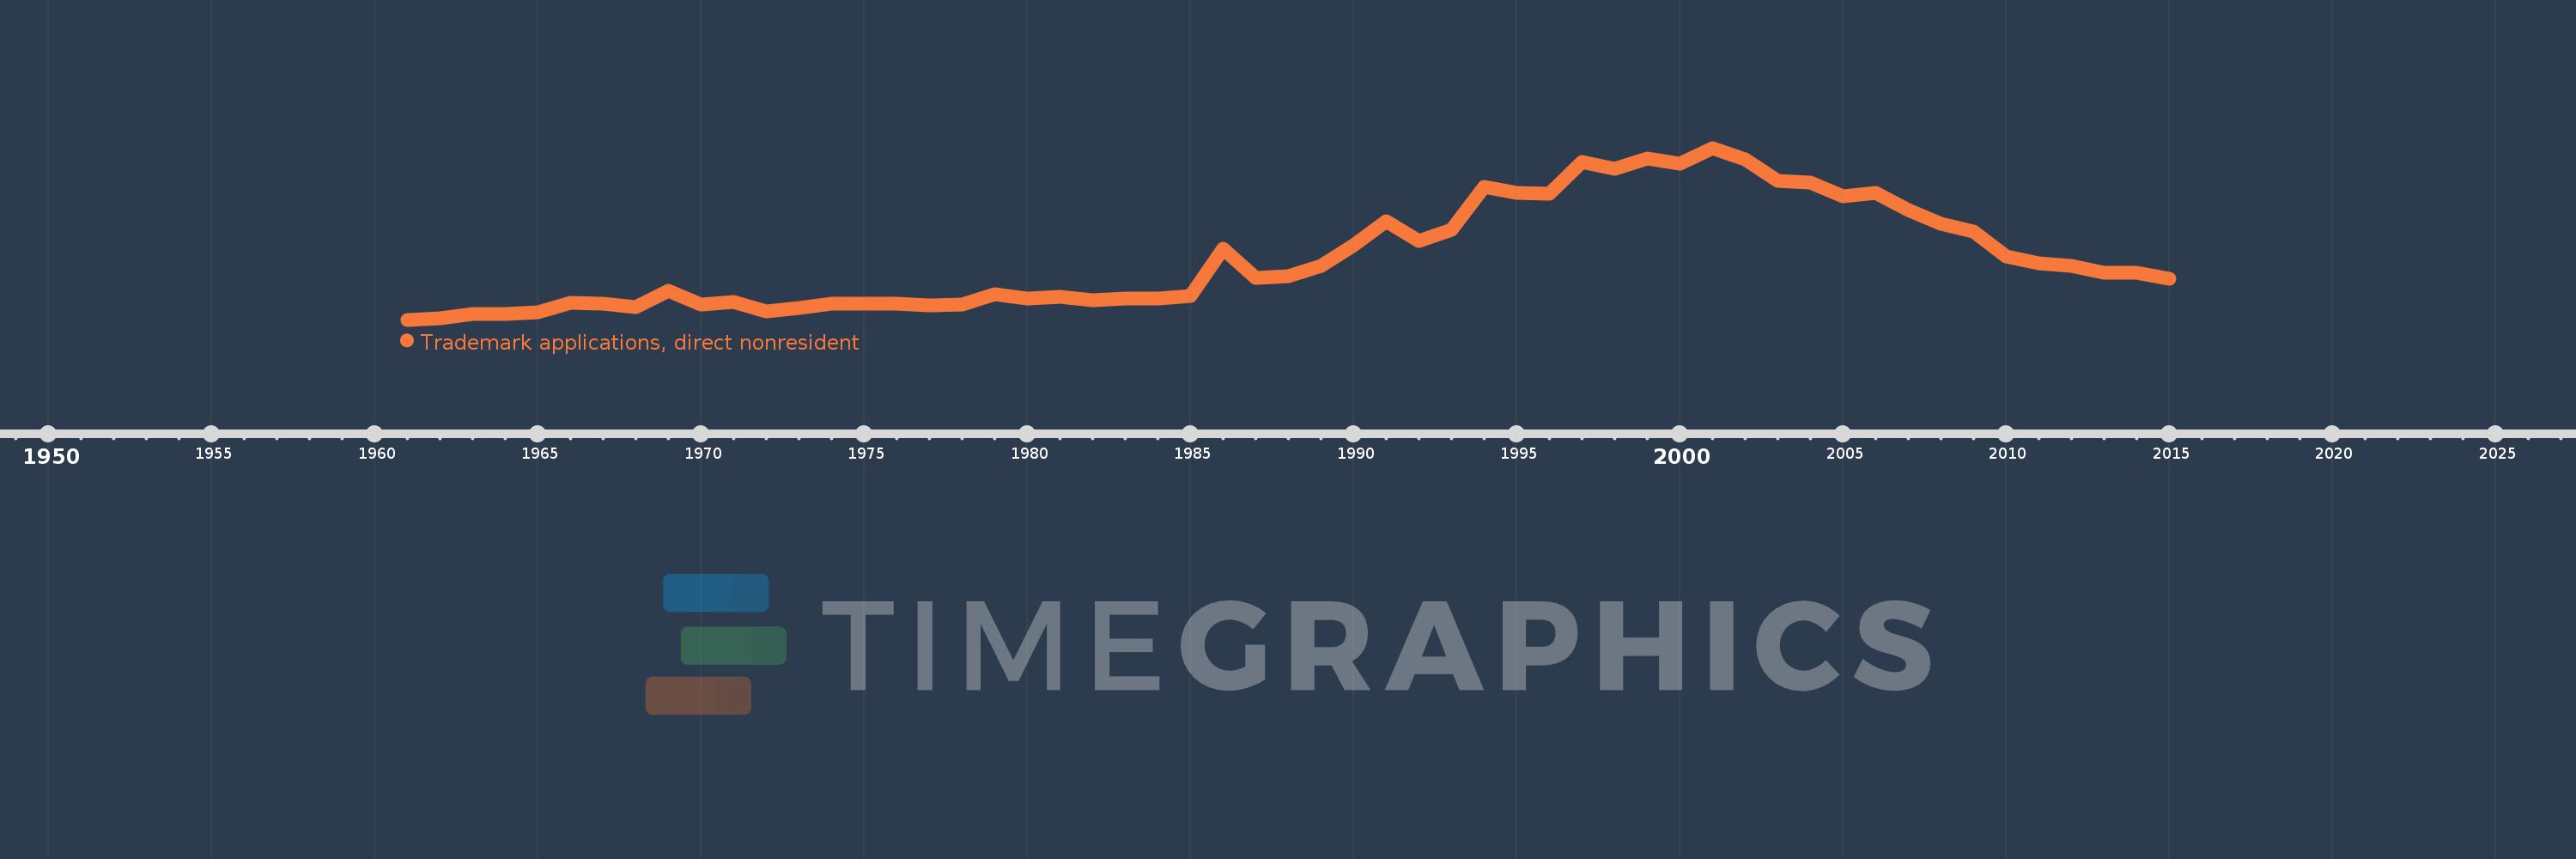
Trademark applications, direct nonresident
2015,2014,2013,2012,2011,2010,2009,2008,2007,2006,2005,2004,2003,2002,2001,2000,1999,1998,1997,1996,1995,1994,1993,1992,1991,1990,1989,1988,1987,1986,1985,1984,1983,1982,1981,1980,1979,1978,1977,1976,1975,1974,1973,1972,1971,1970,1969,1968,1967,1966,1965,1964,1963,1962,1961
This statistics in other country:
AlbaniaAlgeriaAndorraAngolaAntigua and BarbudaArab WorldArgentinaArmeniaArubaAustraliaAustriaAzerbaijanBahamas, TheBahrainBangladeshBarbadosBelarusBelgiumBelizeBhutanBoliviaBosnia and HerzegovinaBotswanaBrazilBrunei DarussalamBulgariaBurundiCambodiaCanadaCaribbean small statesCentral Europe and the BalticsChileChinaColombiaCongo, Dem. Rep.Costa RicaCroatiaCubaCuracaoCyprusCzech RepublicDenmarkDjiboutiDominicaDominican RepublicEarly-demographic dividendEast Asia & PacificEast Asia & Pacific (excluding high income)East Asia & Pacific (IDA & IBRD countries)EcuadorEgypt, Arab Rep.El SalvadorEstoniaEthiopiaEuro areaEurope & Central AsiaEurope & Central Asia (excluding high income)Europe & Central Asia (IDA & IBRD countries)European UnionFijiFinlandFranceGambia, TheGeorgiaGermanyGhanaGreeceGrenadaGuatemalaGuyanaHaitiHigh incomeHondurasHong Kong SAR, ChinaHungaryIBRD onlyIcelandIDA & IBRD totalIDA blendIndiaIndonesiaIran, Islamic Rep.IraqIrelandIsraelItalyJamaicaJapanJordanKazakhstanKenyaKiribatiKorea, Dem. People’s Rep.Korea, Rep.KuwaitKyrgyz RepublicLao PDRLate-demographic dividendLatin America & Caribbean Latin America & Caribbean (excluding high income)Latin America & the Caribbean (IDA & IBRD countries)LatviaLebanonLesothoLiberiaLibyaLiechtensteinLithuaniaLow & middle incomeLower middle incomeLuxembourgMacao SAR, ChinaMacedonia, FYRMadagascarMalawiMalaysiaMaliMaltaMauritiusMexicoMiddle East & North AfricaMiddle East & North Africa (excluding high income)Middle East & North Africa (IDA & IBRD countries)Middle incomeMoldovaMonacoMongoliaMontenegroMoroccoMozambiqueMyanmarNamibiaNepalNetherlandsNew ZealandNicaraguaNigeriaNorth AmericaNorwayOECD membersOmanOther small statesPacific island small statesPakistanPanamaPapua New GuineaParaguayPeruPhilippinesPolandPortugalPost-demographic dividendQatarRomaniaRussian FederationRwandaSamoaSan MarinoSao Tome and PrincipeSaudi ArabiaSerbiaSeychellesSierra LeoneSingaporeSint Maarten (Dutch part)Slovak RepublicSloveniaSmall statesSolomon IslandsSomaliaSouth AfricaSouth AsiaSouth Asia (IDA & IBRD)SpainSri LankaSt. LuciaSt. Vincent and the GrenadinesSudanSurinameSwazilandSwedenSwitzerlandSyrian Arab RepublicTajikistanTanzaniaThailandTongaTrinidad and TobagoTunisiaTurkeyTurkmenistanTuvaluUgandaUkraineUnited Arab EmiratesUnited KingdomUnited StatesUpper middle incomeUruguayUzbekistanVenezuela, RBVietnamWorldYemen, Rep.ZambiaZimbabwe Timeline:
This timeline shows a graph from 1961 to 2015 of Euro area. No data until 1960. Number of actual observations by date: 55.
Source name:
World Development Indicators
Source organization:
World Intellectual Property Organization (WIPO), WIPO Patent Report: Statistics on Worldwide Patent Activity. The International Bureau of WIPO assumes no responsibility with respect to the transformation of these data.
Categories, topics:
Science & Technology
Last updated:
apr 23, 2017
Indicators value changes by year
Minimum:
15.625K
jan 1, 1961
Maximum:
151.273K
jan 1, 2001
At the date of observation
Value
Absolute change
Change from previous value
jan 1, 1961
15.625K
+15.625K
0.0%
jan 1, 1962
16.899K
+1.274K
8.15%
jan 1, 1963
20.311K
+3.412K
20.19%
jan 1, 1964
20.063K
-248.0
-1.22%
jan 1, 1965
21.302K
+1.239K
6.18%
jan 1, 1966
28.884K
+7.582K
35.59%
jan 1, 1967
28.299K
-585.0
-2.03%
jan 1, 1968
25.668K
-2.631K
-9.3%
jan 1, 1969
38.345K
+12.677K
49.39%
jan 1, 1970
27.688K
-10.657K
-27.79%
jan 1, 1971
29.905K
+2.217K
8.01%
jan 1, 1972
22.392K
-7.513K
-25.12%
jan 1, 1973
25.04K
+2.648K
11.83%
jan 1, 1974
28.354K
+3.314K
13.23%
jan 1, 1975
28.451K
+97.0
0.34%
jan 1, 1976
28.088K
-363.0
-1.28%
jan 1, 1977
26.896K
-1.192K
-4.24%
jan 1, 1978
27.605K
+709.0
2.64%
jan 1, 1979
35.653K
+8.048K
29.15%
jan 1, 1980
32.362K
-3.291K
-9.23%
jan 1, 1981
33.554K
+1.192K
3.68%
jan 1, 1982
31.112K
-2.442K
-7.28%
jan 1, 1983
32.227K
+1.115K
3.58%
jan 1, 1984
32.152K
-75.0
-0.23%
jan 1, 1985
34.273K
+2.121K
6.6%
jan 1, 1986
71.568K
+37.295K
108.82%
jan 1, 1987
48.586K
-22.982K
-32.11%
jan 1, 1988
49.778K
+1.192K
2.45%
jan 1, 1989
57.9K
+8.122K
16.32%
jan 1, 1990
74.41K
+16.51K
28.51%
jan 1, 1991
93.244K
+18.834K
25.31%
jan 1, 1992
77.584K
-15.66K
-16.79%
jan 1, 1993
86.968K
+9.384K
12.1%
jan 1, 1994
120.768K
+33.8K
38.86%
jan 1, 1995
115.918K
-4.85K
-4.02%
jan 1, 1996
115.273K
-645.0
-0.56%
jan 1, 1997
140.448K
+25.175K
21.84%
jan 1, 1998
134.468K
-5.98K
-4.26%
jan 1, 1999
142.795K
+8.327K
6.19%
jan 1, 2000
138.857K
-3.938K
-2.76%
jan 1, 2001
151.273K
+12.416K
8.94%
jan 1, 2002
142.229K
-9.044K
-5.98%
jan 1, 2003
125.455K
-16.774K
-11.79%
jan 1, 2004
124.179K
-1.276K
-1.02%
jan 1, 2005
112.825K
-11.354K
-9.14%
jan 1, 2006
115.665K
+2.84K
2.52%
jan 1, 2007
102.103K
-13.562K
-11.73%
jan 1, 2008
91.42K
-10.683K
-10.46%
jan 1, 2009
85.101K
-6.319K
-6.91%
jan 1, 2010
65.621K
-19.48K
-22.89%
jan 1, 2011
59.946K
-5.675K
-8.65%
jan 1, 2012
58.227K
-1.719K
-2.87%
jan 1, 2013
52.943K
-5.284K
-9.07%
jan 1, 2014
52.562K
-381.0
-0.72%
jan 1, 2015
48.23K
-4.332K
-8.24%
Ranking of countries by current statistics by years


Comments: