29
/
en
AIzaSyAYiBZKx7MnpbEhh9jyipgxe19OcubqV5w
April 1, 2024
124303
Ecuador
ECU
true
2
1
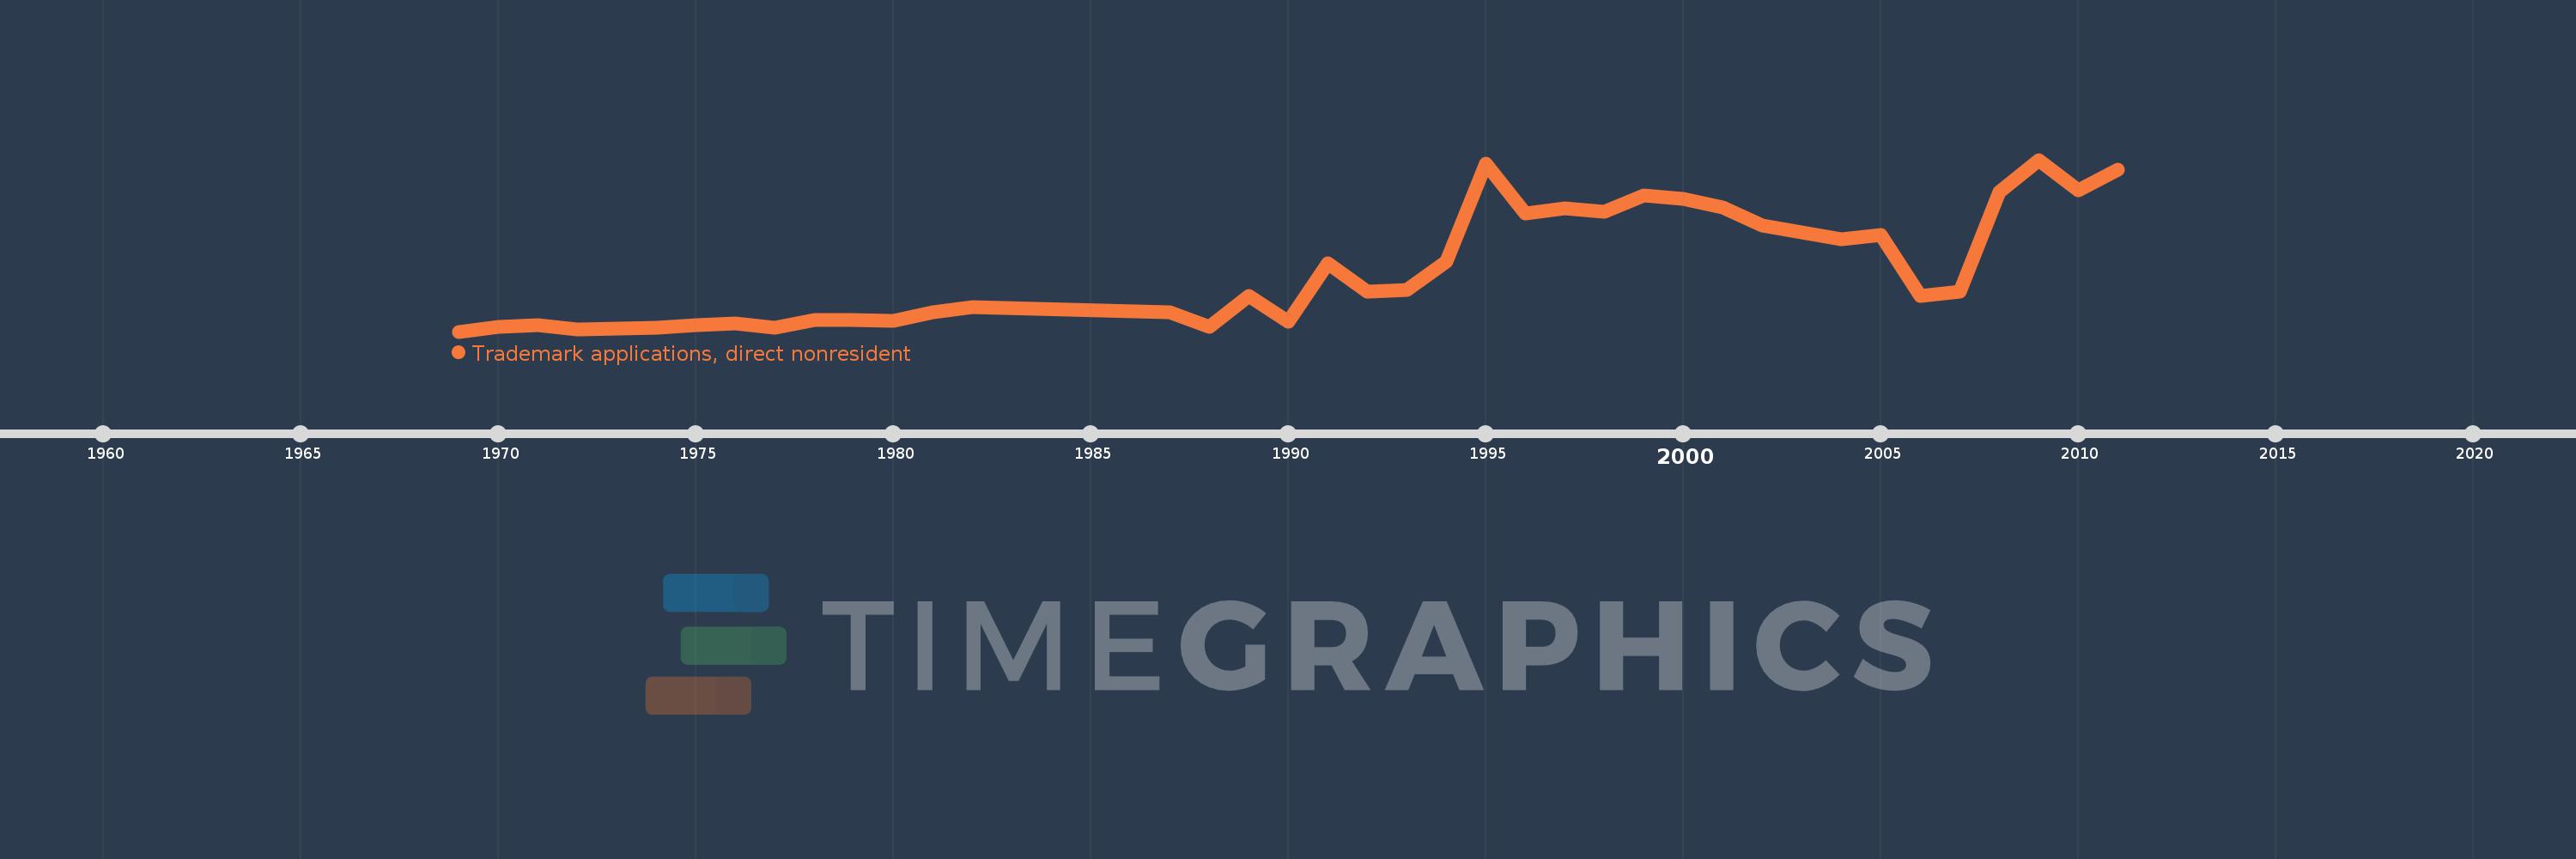
Trademark applications, direct nonresident
2011,2010,2009,2008,2007,2006,2005,2004,2003,2002,2001,2000,1999,1998,1997,1996,1995,1994,1993,1992,1991,1990,1989,1988,1987,1982,1981,1980,1979,1978,1977,1976,1975,1974,1972,1971,1970,1969
This statistics in other country:
AlbaniaAlgeriaAndorraAngolaAntigua and BarbudaArab WorldArgentinaArmeniaArubaAustraliaAustriaAzerbaijanBahamas, TheBahrainBangladeshBarbadosBelarusBelgiumBelizeBhutanBoliviaBosnia and HerzegovinaBotswanaBrazilBrunei DarussalamBulgariaBurundiCambodiaCanadaCaribbean small statesCentral Europe and the BalticsChileChinaColombiaCongo, Dem. Rep.Costa RicaCroatiaCubaCuracaoCyprusCzech RepublicDenmarkDjiboutiDominicaDominican RepublicEarly-demographic dividendEast Asia & PacificEast Asia & Pacific (excluding high income)East Asia & Pacific (IDA & IBRD countries)EcuadorEgypt, Arab Rep.El SalvadorEstoniaEthiopiaEuro areaEurope & Central AsiaEurope & Central Asia (excluding high income)Europe & Central Asia (IDA & IBRD countries)European UnionFijiFinlandFranceGambia, TheGeorgiaGermanyGhanaGreeceGrenadaGuatemalaGuyanaHaitiHigh incomeHondurasHong Kong SAR, ChinaHungaryIBRD onlyIcelandIDA & IBRD totalIDA blendIndiaIndonesiaIran, Islamic Rep.IraqIrelandIsraelItalyJamaicaJapanJordanKazakhstanKenyaKiribatiKorea, Dem. People’s Rep.Korea, Rep.KuwaitKyrgyz RepublicLao PDRLate-demographic dividendLatin America & Caribbean Latin America & Caribbean (excluding high income)Latin America & the Caribbean (IDA & IBRD countries)LatviaLebanonLesothoLiberiaLibyaLiechtensteinLithuaniaLow & middle incomeLower middle incomeLuxembourgMacao SAR, ChinaMacedonia, FYRMadagascarMalawiMalaysiaMaliMaltaMauritiusMexicoMiddle East & North AfricaMiddle East & North Africa (excluding high income)Middle East & North Africa (IDA & IBRD countries)Middle incomeMoldovaMonacoMongoliaMontenegroMoroccoMozambiqueMyanmarNamibiaNepalNetherlandsNew ZealandNicaraguaNigeriaNorth AmericaNorwayOECD membersOmanOther small statesPacific island small statesPakistanPanamaPapua New GuineaParaguayPeruPhilippinesPolandPortugalPost-demographic dividendQatarRomaniaRussian FederationRwandaSamoaSan MarinoSao Tome and PrincipeSaudi ArabiaSerbiaSeychellesSierra LeoneSingaporeSint Maarten (Dutch part)Slovak RepublicSloveniaSmall statesSolomon IslandsSomaliaSouth AfricaSouth AsiaSouth Asia (IDA & IBRD)SpainSri LankaSt. LuciaSt. Vincent and the GrenadinesSudanSurinameSwazilandSwedenSwitzerlandSyrian Arab RepublicTajikistanTanzaniaThailandTongaTrinidad and TobagoTunisiaTurkeyTurkmenistanTuvaluUgandaUkraineUnited Arab EmiratesUnited KingdomUnited StatesUpper middle incomeUruguayUzbekistanVenezuela, RBVietnamWorldYemen, Rep.ZambiaZimbabwe Timeline:
This timeline shows a graph from 1969 to 2011 of Ecuador. No data until 1968. Number of actual observations by date: 38.
Source name:
World Development Indicators
Source organization:
World Intellectual Property Organization (WIPO), WIPO Patent Report: Statistics on Worldwide Patent Activity. The International Bureau of WIPO assumes no responsibility with respect to the transformation of these data.
Categories, topics:
Science & Technology
Last updated:
apr 23, 2017
Indicators value changes by year
Maximum:
7.872K
jan 1, 2009
At the date of observation
Value
Absolute change
Change from previous value
jan 1, 1969
747.0
+747.0
0.0%
jan 1, 1970
939.0
+192.0
25.7%
jan 1, 1971
1.03K
+91.0
9.69%
jan 1, 1972
843.0
-187.0
-18.16%
jan 1, 1974
890.0
+47.0
5.58%
jan 1, 1975
999.0
+109.0
12.25%
jan 1, 1976
1.07K
+71.0
7.11%
jan 1, 1977
920.0
-150.0
-14.02%
jan 1, 1978
1.229K
+309.0
33.59%
jan 1, 1979
1.214K
-15.0
-1.22%
jan 1, 1980
1.196K
-18.0
-1.48%
jan 1, 1981
1.565K
+369.0
30.85%
jan 1, 1982
1.747K
+182.0
11.63%
jan 1, 1987
1.56K
-187.0
-10.7%
jan 1, 1988
958.0
-602.0
-38.59%
jan 1, 1989
2.239K
+1.281K
133.72%
jan 1, 1990
1.16K
-1.079K
-48.19%
jan 1, 1991
3.563K
+2.403K
207.16%
jan 1, 1992
2.392K
-1.171K
-32.87%
jan 1, 1993
2.476K
+84.0
3.51%
jan 1, 1994
3.66K
+1.184K
47.82%
jan 1, 1995
7.717K
+4.057K
110.85%
jan 1, 1996
5.657K
-2.06K
-26.69%
jan 1, 1997
5.874K
+217.0
3.84%
jan 1, 1998
5.713K
-161.0
-2.74%
jan 1, 1999
6.379K
+666.0
11.66%
jan 1, 2000
6.256K
-123.0
-1.93%
jan 1, 2001
5.892K
-364.0
-5.82%
jan 1, 2002
5.155K
-737.0
-12.51%
jan 1, 2003
4.878K
-277.0
-5.37%
jan 1, 2004
4.576K
-302.0
-6.19%
jan 1, 2005
4.769K
+193.0
4.22%
jan 1, 2006
2.224K
-2.545K
-53.37%
jan 1, 2007
2.387K
+163.0
7.33%
jan 1, 2008
6.527K
+4.14K
173.44%
jan 1, 2009
7.872K
+1.345K
20.61%
jan 1, 2010
6.592K
-1.28K
-16.26%
jan 1, 2011
7.445K
+853.0
12.94%
Ranking of countries by current statistics by years


Comments: