29
/
en
AIzaSyAYiBZKx7MnpbEhh9jyipgxe19OcubqV5w
April 1, 2024
249565
Sri Lanka
LKA
true
2
1
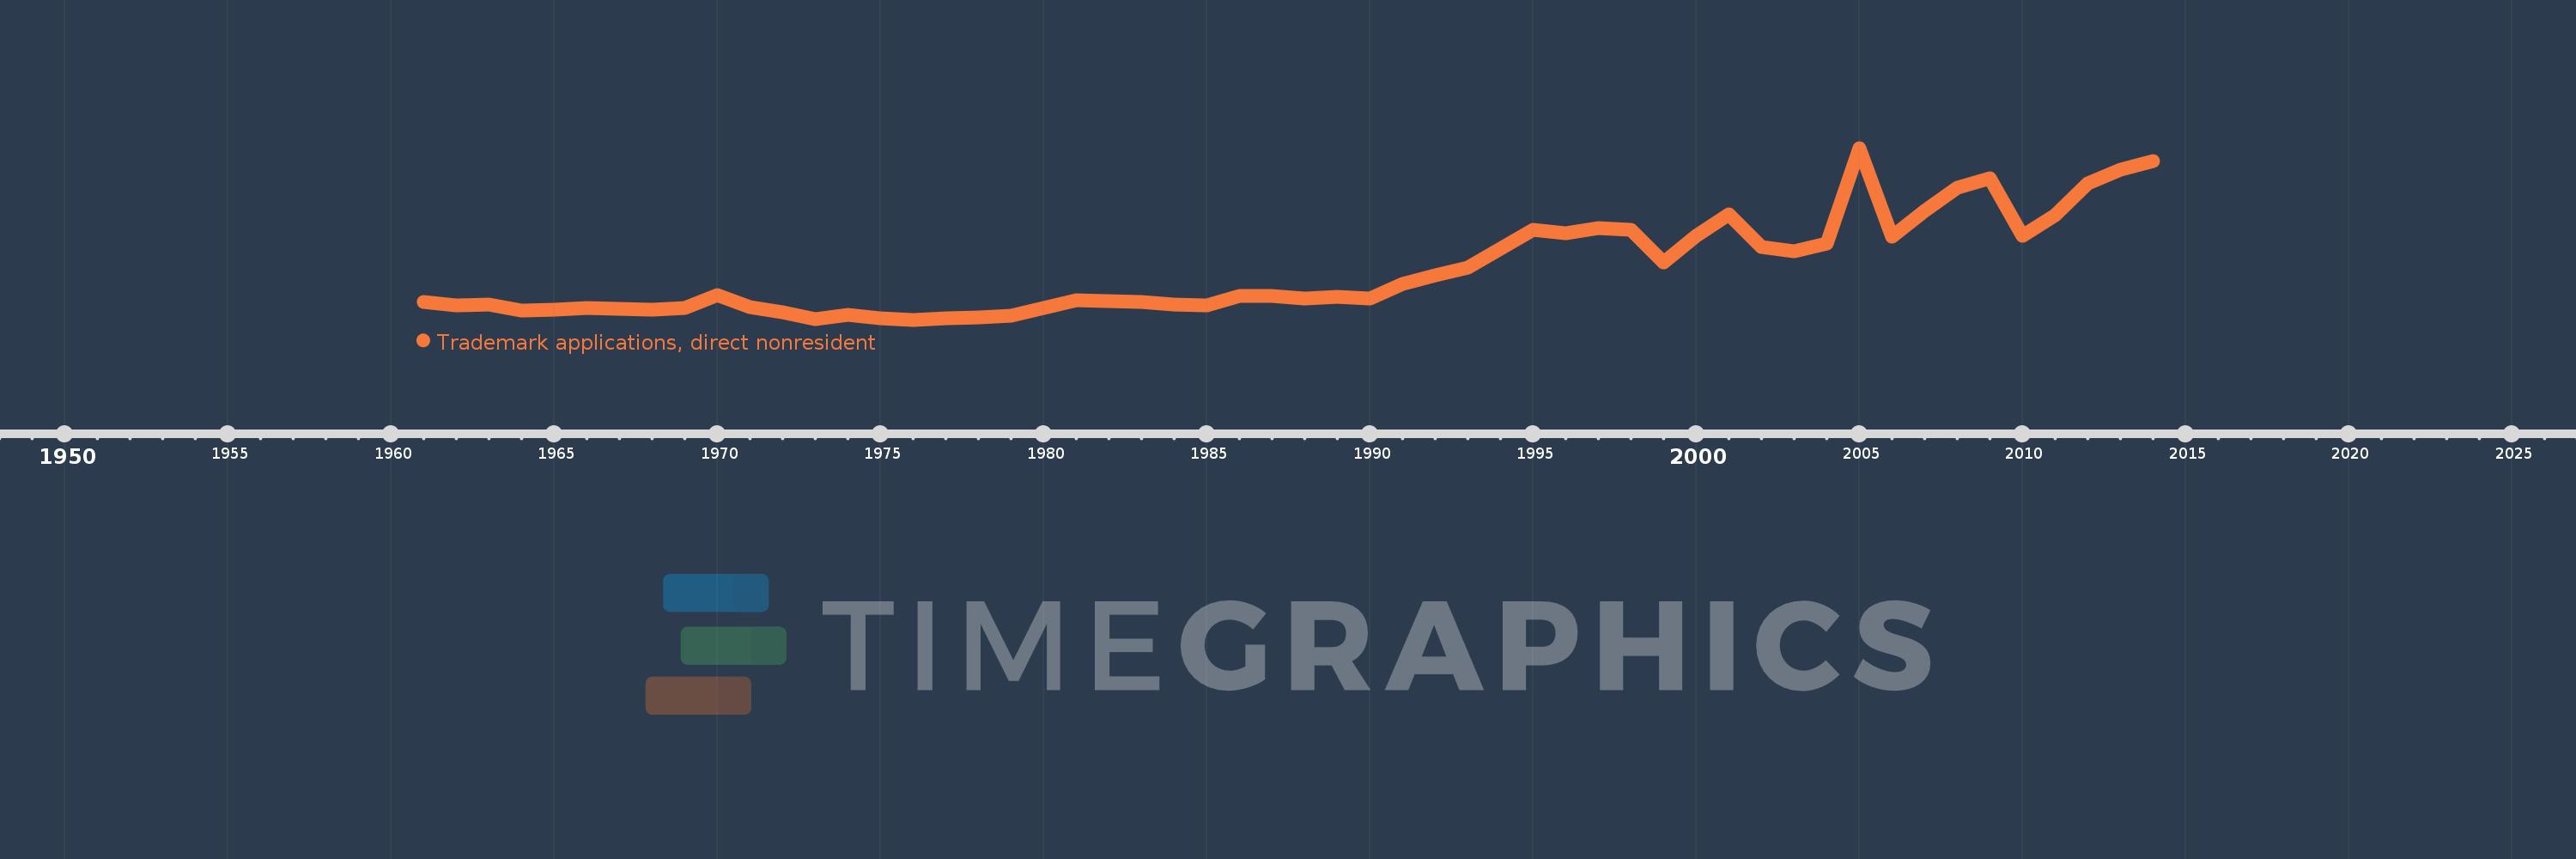
Trademark applications, direct nonresident
2014,2013,2012,2011,2010,2009,2008,2007,2006,2005,2004,2003,2002,2001,2000,1999,1998,1997,1996,1995,1994,1993,1992,1991,1990,1989,1988,1987,1986,1985,1984,1983,1982,1981,1980,1979,1978,1977,1976,1975,1974,1973,1972,1971,1970,1969,1968,1967,1966,1965,1964,1963,1962,1961
This statistics in other country:
AlbaniaAlgeriaAndorraAngolaAntigua and BarbudaArab WorldArgentinaArmeniaArubaAustraliaAustriaAzerbaijanBahamas, TheBahrainBangladeshBarbadosBelarusBelgiumBelizeBhutanBoliviaBosnia and HerzegovinaBotswanaBrazilBrunei DarussalamBulgariaBurundiCambodiaCanadaCaribbean small statesCentral Europe and the BalticsChileChinaColombiaCongo, Dem. Rep.Costa RicaCroatiaCubaCuracaoCyprusCzech RepublicDenmarkDjiboutiDominicaDominican RepublicEarly-demographic dividendEast Asia & PacificEast Asia & Pacific (excluding high income)East Asia & Pacific (IDA & IBRD countries)EcuadorEgypt, Arab Rep.El SalvadorEstoniaEthiopiaEuro areaEurope & Central AsiaEurope & Central Asia (excluding high income)Europe & Central Asia (IDA & IBRD countries)European UnionFijiFinlandFranceGambia, TheGeorgiaGermanyGhanaGreeceGrenadaGuatemalaGuyanaHaitiHigh incomeHondurasHong Kong SAR, ChinaHungaryIBRD onlyIcelandIDA & IBRD totalIDA blendIndiaIndonesiaIran, Islamic Rep.IraqIrelandIsraelItalyJamaicaJapanJordanKazakhstanKenyaKiribatiKorea, Dem. People’s Rep.Korea, Rep.KuwaitKyrgyz RepublicLao PDRLate-demographic dividendLatin America & Caribbean Latin America & Caribbean (excluding high income)Latin America & the Caribbean (IDA & IBRD countries)LatviaLebanonLesothoLiberiaLibyaLiechtensteinLithuaniaLow & middle incomeLower middle incomeLuxembourgMacao SAR, ChinaMacedonia, FYRMadagascarMalawiMalaysiaMaliMaltaMauritiusMexicoMiddle East & North AfricaMiddle East & North Africa (excluding high income)Middle East & North Africa (IDA & IBRD countries)Middle incomeMoldovaMonacoMongoliaMontenegroMoroccoMozambiqueMyanmarNamibiaNepalNetherlandsNew ZealandNicaraguaNigeriaNorth AmericaNorwayOECD membersOmanOther small statesPacific island small statesPakistanPanamaPapua New GuineaParaguayPeruPhilippinesPolandPortugalPost-demographic dividendQatarRomaniaRussian FederationRwandaSamoaSan MarinoSao Tome and PrincipeSaudi ArabiaSerbiaSeychellesSierra LeoneSingaporeSint Maarten (Dutch part)Slovak RepublicSloveniaSmall statesSolomon IslandsSomaliaSouth AfricaSouth AsiaSouth Asia (IDA & IBRD)SpainSri LankaSt. LuciaSt. Vincent and the GrenadinesSudanSurinameSwazilandSwedenSwitzerlandSyrian Arab RepublicTajikistanTanzaniaThailandTongaTrinidad and TobagoTunisiaTurkeyTurkmenistanTuvaluUgandaUkraineUnited Arab EmiratesUnited KingdomUnited StatesUpper middle incomeUruguayUzbekistanVenezuela, RBVietnamWorldYemen, Rep.ZambiaZimbabwe Timeline:
This timeline shows a graph from 1961 to 2014 of Sri Lanka. No data until 1960. Number of actual observations by date: 54.
Source name:
World Development Indicators
Source organization:
World Intellectual Property Organization (WIPO), WIPO Patent Report: Statistics on Worldwide Patent Activity. The International Bureau of WIPO assumes no responsibility with respect to the transformation of these data.
Categories, topics:
Science & Technology
Last updated:
apr 23, 2017
Indicators value changes by year
At the date of observation
Value
Absolute change
Change from previous value
jan 1, 1961
646.0
+646.0
0.0%
jan 1, 1962
582.0
-64.0
-9.91%
jan 1, 1963
589.0
+7.0
1.2%
jan 1, 1964
474.0
-115.0
-19.52%
jan 1, 1965
495.0
+21.0
4.43%
jan 1, 1966
532.0
+37.0
7.47%
jan 1, 1967
515.0
-17.0
-3.2%
jan 1, 1968
504.0
-11.0
-2.14%
jan 1, 1969
523.0
+19.0
3.77%
jan 1, 1970
783.0
+260.0
49.71%
jan 1, 1971
550.0
-233.0
-29.76%
jan 1, 1972
440.0
-110.0
-20.0%
jan 1, 1973
316.0
-124.0
-28.18%
jan 1, 1974
394.0
+78.0
24.68%
jan 1, 1975
334.0
-60.0
-15.23%
jan 1, 1976
303.0
-31.0
-9.28%
jan 1, 1977
328.0
+25.0
8.25%
jan 1, 1978
352.0
+24.0
7.32%
jan 1, 1979
373.0
+21.0
5.97%
jan 1, 1980
530.0
+157.0
42.09%
jan 1, 1981
670.0
+140.0
26.42%
jan 1, 1982
655.0
-15.0
-2.24%
jan 1, 1983
640.0
-15.0
-2.29%
jan 1, 1984
598.0
-42.0
-6.56%
jan 1, 1985
572.0
-26.0
-4.35%
jan 1, 1986
766.0
+194.0
33.92%
jan 1, 1987
753.0
-13.0
-1.7%
jan 1, 1988
707.0
-46.0
-6.11%
jan 1, 1989
750.0
+43.0
6.08%
jan 1, 1990
708.0
-42.0
-5.6%
jan 1, 1991
994.0
+286.0
40.4%
jan 1, 1992
1.153K
+159.0
16.0%
jan 1, 1993
1.297K
+144.0
12.49%
jan 1, 1994
1.671K
+374.0
28.84%
jan 1, 1995
2.028K
+357.0
21.36%
jan 1, 1996
1.967K
-61.0
-3.01%
jan 1, 1997
2.066K
+99.0
5.03%
jan 1, 1998
2.035K
-31.0
-1.5%
jan 1, 1999
1.397K
-638.0
-31.35%
jan 1, 2000
1.906K
+509.0
36.44%
jan 1, 2001
2.321K
+415.0
21.77%
jan 1, 2002
1.705K
-616.0
-26.54%
jan 1, 2003
1.613K
-92.0
-5.4%
jan 1, 2004
1.773K
+160.0
9.92%
jan 1, 2005
3.6K
+1.827K
103.05%
jan 1, 2006
1.9K
-1.7K
-47.22%
jan 1, 2007
2.392K
+492.0
25.89%
jan 1, 2008
2.835K
+443.0
18.52%
jan 1, 2009
3.012K
+177.0
6.24%
jan 1, 2010
1.915K
-1.097K
-36.42%
jan 1, 2011
2.302K
+387.0
20.21%
jan 1, 2012
2.925K
+623.0
27.06%
jan 1, 2013
3.178K
+253.0
8.65%
jan 1, 2014
3.344K
+166.0
5.22%
Ranking of countries by current statistics by years


Comments: