29
/
en
AIzaSyAYiBZKx7MnpbEhh9jyipgxe19OcubqV5w
April 1, 2024
240079
Sierra Leone
SLE
true
2
1
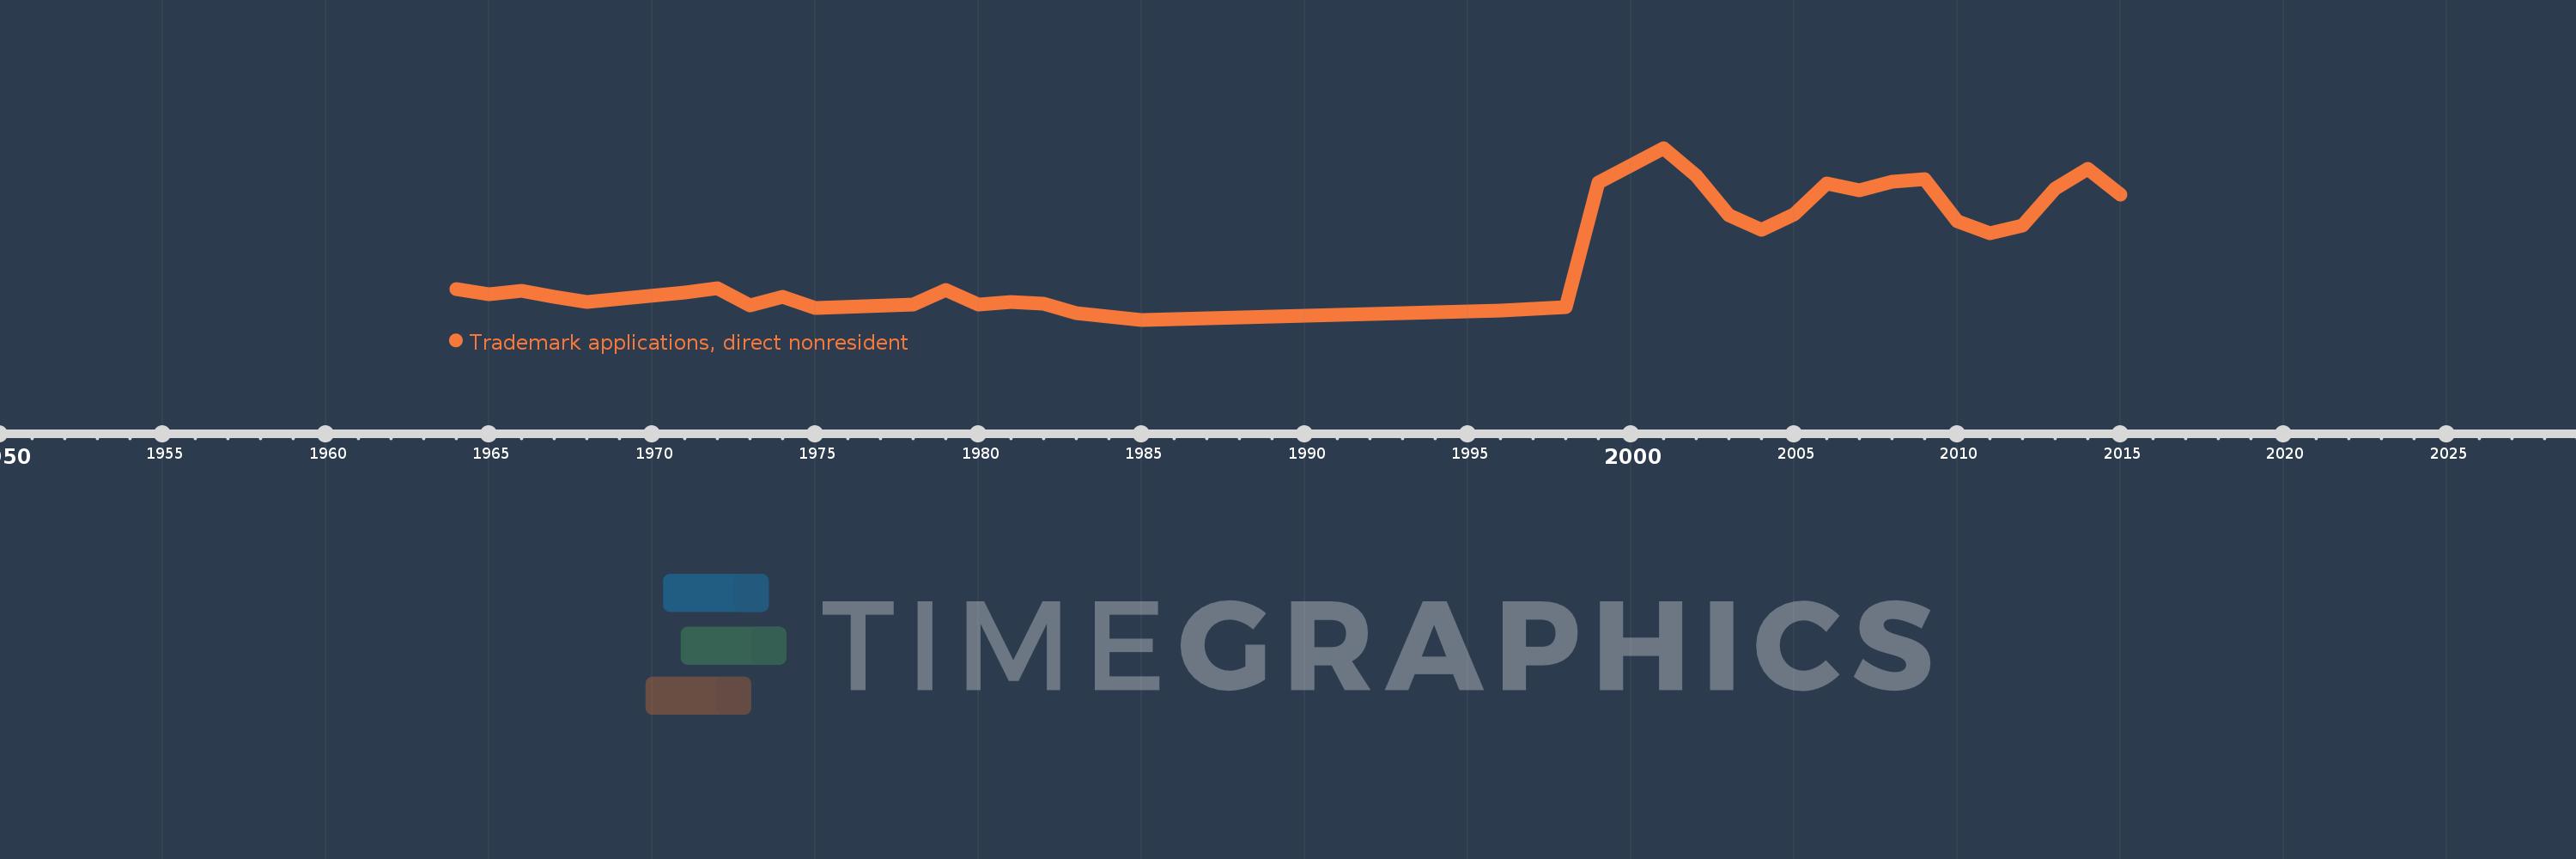
Trademark applications, direct nonresident
2015,2014,2013,2012,2011,2010,2009,2008,2007,2006,2005,2004,2003,2002,2001,1999,1998,1996,1985,1983,1982,1981,1980,1979,1978,1975,1974,1973,1972,1971,1968,1967,1966,1965,1964
This statistics in other country:
AlbaniaAlgeriaAndorraAngolaAntigua and BarbudaArab WorldArgentinaArmeniaArubaAustraliaAustriaAzerbaijanBahamas, TheBahrainBangladeshBarbadosBelarusBelgiumBelizeBhutanBoliviaBosnia and HerzegovinaBotswanaBrazilBrunei DarussalamBulgariaBurundiCambodiaCanadaCaribbean small statesCentral Europe and the BalticsChileChinaColombiaCongo, Dem. Rep.Costa RicaCroatiaCubaCuracaoCyprusCzech RepublicDenmarkDjiboutiDominicaDominican RepublicEarly-demographic dividendEast Asia & PacificEast Asia & Pacific (excluding high income)East Asia & Pacific (IDA & IBRD countries)EcuadorEgypt, Arab Rep.El SalvadorEstoniaEthiopiaEuro areaEurope & Central AsiaEurope & Central Asia (excluding high income)Europe & Central Asia (IDA & IBRD countries)European UnionFijiFinlandFranceGambia, TheGeorgiaGermanyGhanaGreeceGrenadaGuatemalaGuyanaHaitiHigh incomeHondurasHong Kong SAR, ChinaHungaryIBRD onlyIcelandIDA & IBRD totalIDA blendIndiaIndonesiaIran, Islamic Rep.IraqIrelandIsraelItalyJamaicaJapanJordanKazakhstanKenyaKiribatiKorea, Dem. People’s Rep.Korea, Rep.KuwaitKyrgyz RepublicLao PDRLate-demographic dividendLatin America & Caribbean Latin America & Caribbean (excluding high income)Latin America & the Caribbean (IDA & IBRD countries)LatviaLebanonLesothoLiberiaLibyaLiechtensteinLithuaniaLow & middle incomeLower middle incomeLuxembourgMacao SAR, ChinaMacedonia, FYRMadagascarMalawiMalaysiaMaliMaltaMauritiusMexicoMiddle East & North AfricaMiddle East & North Africa (excluding high income)Middle East & North Africa (IDA & IBRD countries)Middle incomeMoldovaMonacoMongoliaMontenegroMoroccoMozambiqueMyanmarNamibiaNepalNetherlandsNew ZealandNicaraguaNigeriaNorth AmericaNorwayOECD membersOmanOther small statesPacific island small statesPakistanPanamaPapua New GuineaParaguayPeruPhilippinesPolandPortugalPost-demographic dividendQatarRomaniaRussian FederationRwandaSamoaSan MarinoSao Tome and PrincipeSaudi ArabiaSerbiaSeychellesSierra LeoneSingaporeSint Maarten (Dutch part)Slovak RepublicSloveniaSmall statesSolomon IslandsSomaliaSouth AfricaSouth AsiaSouth Asia (IDA & IBRD)SpainSri LankaSt. LuciaSt. Vincent and the GrenadinesSudanSurinameSwazilandSwedenSwitzerlandSyrian Arab RepublicTajikistanTanzaniaThailandTongaTrinidad and TobagoTunisiaTurkeyTurkmenistanTuvaluUgandaUkraineUnited Arab EmiratesUnited KingdomUnited StatesUpper middle incomeUruguayUzbekistanVenezuela, RBVietnamWorldYemen, Rep.ZambiaZimbabwe Timeline:
This timeline shows a graph from 1964 to 2015 of Sierra Leone. No data until 1963. Number of actual observations by date: 35.
Source name:
World Development Indicators
Source organization:
World Intellectual Property Organization (WIPO), WIPO Patent Report: Statistics on Worldwide Patent Activity. The International Bureau of WIPO assumes no responsibility with respect to the transformation of these data.
Categories, topics:
Science & Technology
Last updated:
apr 23, 2017
Indicators value changes by year
Maximum:
1.212K
jan 1, 2001
At the date of observation
Value
Absolute change
Change from previous value
jan 1, 1964
323.0
+323.0
0.0%
jan 1, 1965
291.0
-32.0
-9.91%
jan 1, 1966
309.0
+18.0
6.19%
jan 1, 1967
273.0
-36.0
-11.65%
jan 1, 1968
239.0
-34.0
-12.45%
jan 1, 1971
302.0
+63.0
26.36%
jan 1, 1972
328.0
+26.0
8.61%
jan 1, 1973
219.0
-109.0
-33.23%
jan 1, 1974
271.0
+52.0
23.74%
jan 1, 1975
202.0
-69.0
-25.46%
jan 1, 1978
226.0
+24.0
11.88%
jan 1, 1979
317.0
+91.0
40.27%
jan 1, 1980
226.0
-91.0
-28.71%
jan 1, 1981
238.0
+12.0
5.31%
jan 1, 1982
228.0
-10.0
-4.2%
jan 1, 1983
172.0
-56.0
-24.56%
jan 1, 1985
128.0
-44.0
-25.58%
jan 1, 1996
187.0
+59.0
46.09%
jan 1, 1998
208.0
+21.0
11.23%
jan 1, 1999
994.0
+786.0
377.88%
jan 1, 2001
1.212K
+218.0
21.93%
jan 1, 2002
1.038K
-174.0
-14.36%
jan 1, 2003
787.0
-251.0
-24.18%
jan 1, 2004
698.0
-89.0
-11.31%
jan 1, 2005
793.0
+95.0
13.61%
jan 1, 2006
986.0
+193.0
24.34%
jan 1, 2007
945.0
-41.0
-4.16%
jan 1, 2008
999.0
+54.0
5.71%
jan 1, 2009
1.017K
+18.0
1.8%
jan 1, 2010
750.0
-267.0
-26.25%
jan 1, 2011
674.0
-76.0
-10.13%
jan 1, 2012
724.0
+50.0
7.42%
jan 1, 2013
954.0
+230.0
31.77%
jan 1, 2014
1.08K
+126.0
13.21%
jan 1, 2015
917.0
-163.0
-15.09%
Ranking of countries by current statistics by years


Comments: