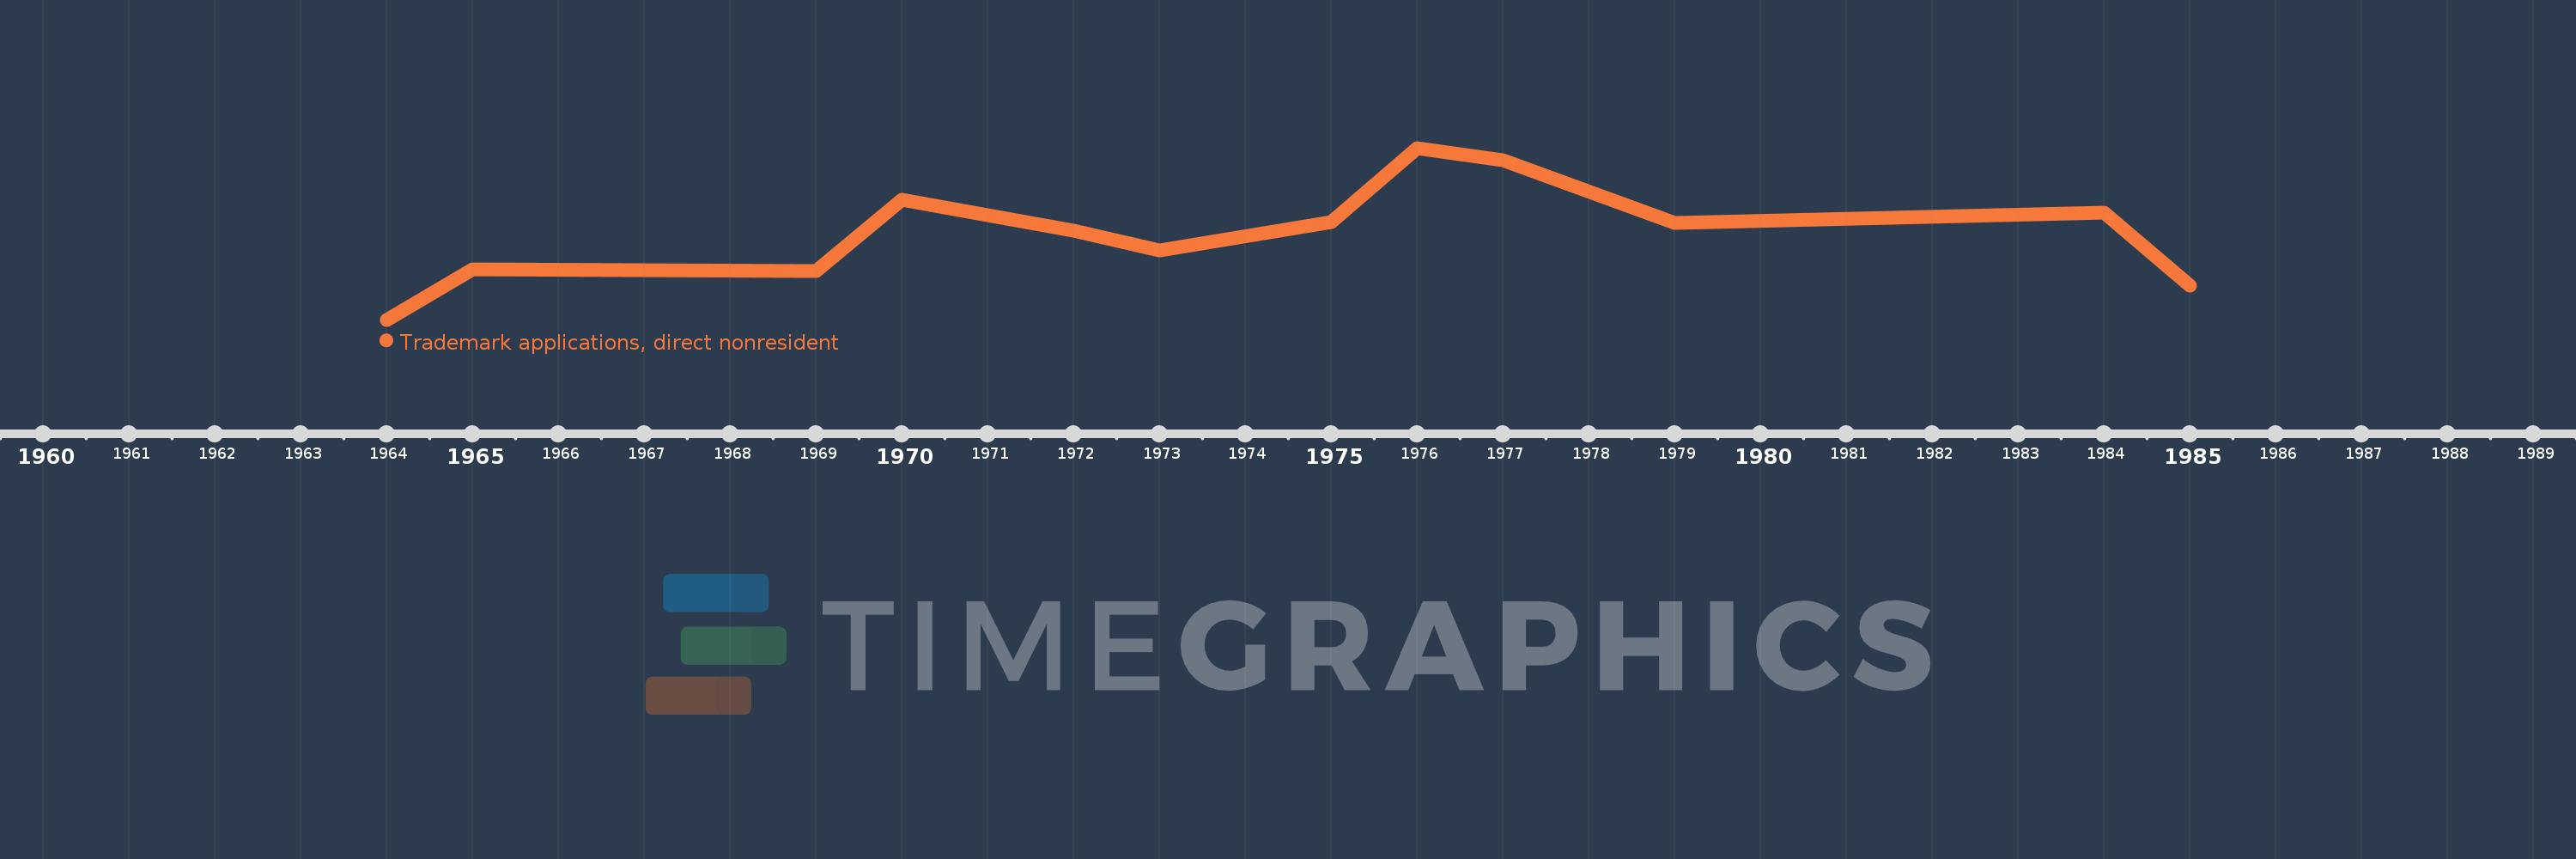
This timeline shows a graph from 1964 to 1985 of Somalia. No data until 1963. Number of actual observations by date: 12.
Source name:
World Development Indicators
Source organization:
World Intellectual Property Organization (WIPO), WIPO Patent Report: Statistics on Worldwide Patent Activity. The International Bureau of WIPO assumes no responsibility with respect to the transformation of these data.
Categories, topics:
Science & Technology
Last updated:
apr 23, 2017
Indicators value changes by year
Meaning:
117.667
Minimum:
28.0
jan 1, 1964
Maximum:
205.0
jan 1, 1976
At the date of observation
Value
Absolute change
Change from the previous value
jan 1, 1964
28.0
+28.0
0.0%
jan 1, 1965
80.0
+52.0
185.71%
jan 1, 1969
78.0
-2.0
-2.5%
jan 1, 1970
152.0
+74.0
94.87%
jan 1, 1972
120.0
-32.0
-21.05%
jan 1, 1973
99.0
-21.0
-17.5%
jan 1, 1975
129.0
+30.0
30.3%
jan 1, 1976
205.0
+76.0
58.91%
jan 1, 1977
192.0
-13.0
-6.34%
jan 1, 1979
128.0
-64.0
-33.33%
jan 1, 1984
138.0
+10.0
7.81%
jan 1, 1985
63.0
-75.0
-54.35%
Ranking of countries by current statistics by years
