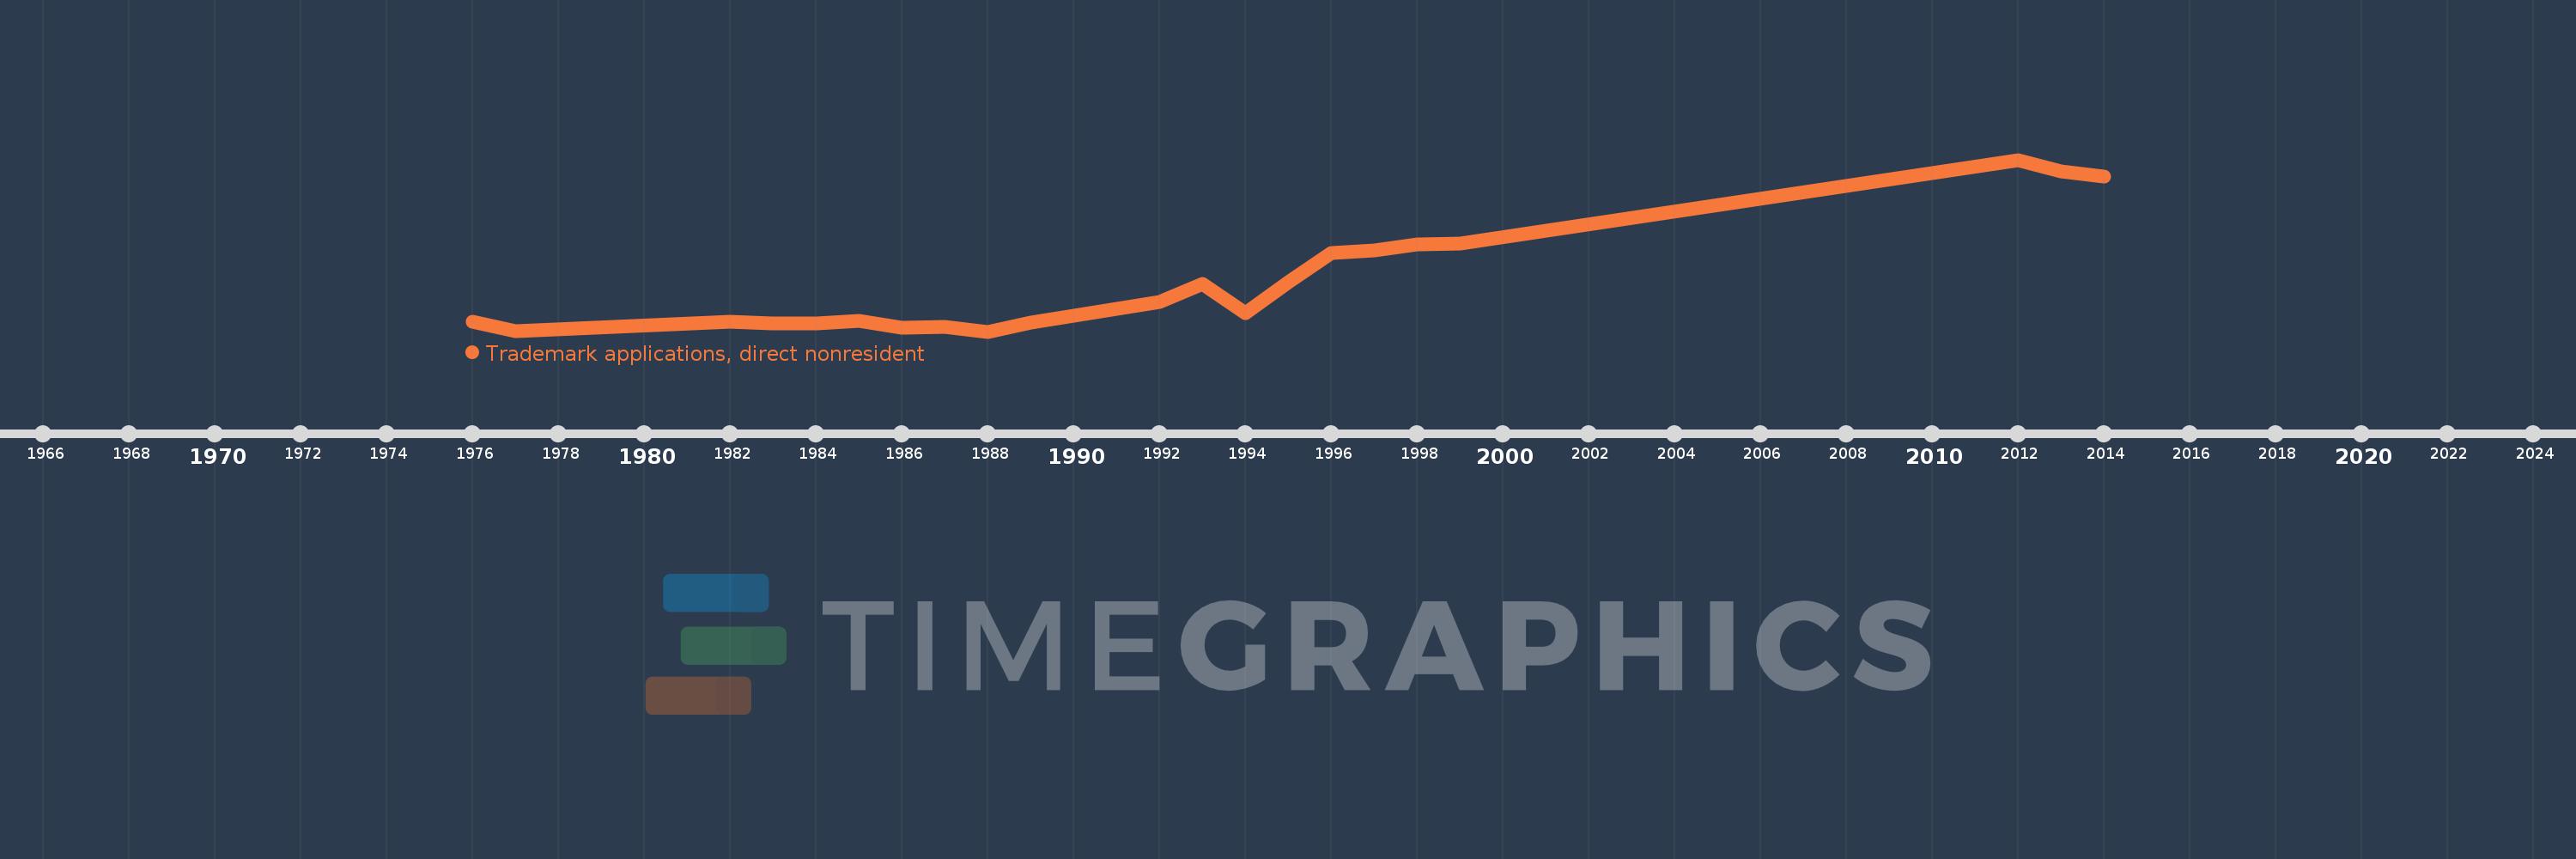
This timeline shows a graph from 1976 to 2014 of Mauritius. No data until 1975. Number of actual observations by date: 22.
Source name:
World Development Indicators
Source organization:
World Intellectual Property Organization (WIPO), WIPO Patent Report: Statistics on Worldwide Patent Activity. The International Bureau of WIPO assumes no responsibility with respect to the transformation of these data.
Categories, topics:
Science & Technology
Last updated:
apr 23, 2017
Indicators value changes by year
Meaning:
428.955
Minimum:
186.0
jan 1, 1988
Maximum:
1.058K
jan 1, 2012
At the date of observation
Value
Absolute change
Change from the previous value
jan 1, 1976
234.0
+234.0
0.0%
jan 1, 1977
190.0
-44.0
-18.8%
jan 1, 1982
236.0
+46.0
24.21%
jan 1, 1983
228.0
-8.0
-3.39%
jan 1, 1984
229.0
+1.0
0.44%
jan 1, 1985
240.0
+11.0
4.8%
jan 1, 1986
204.0
-36.0
-15.0%
jan 1, 1987
208.0
+4.0
1.96%
jan 1, 1988
186.0
-22.0
-10.58%
jan 1, 1989
231.0
+45.0
24.19%
jan 1, 1991
302.0
+71.0
30.74%
jan 1, 1992
335.0
+33.0
10.93%
jan 1, 1993
428.0
+93.0
27.76%
jan 1, 1994
279.0
-149.0
-34.81%
jan 1, 1995
437.0
+158.0
56.63%
jan 1, 1996
585.0
+148.0
33.87%
jan 1, 1997
596.0
+11.0
1.88%
jan 1, 1998
630.0
+34.0
5.7%
jan 1, 1999
633.0
+3.0
0.48%
jan 1, 2012
1.058K
+425.0
67.14%
jan 1, 2013
997.0
-61.0
-5.77%
jan 1, 2014
971.0
-26.0
-2.61%
Ranking of countries by current statistics by years
