29
/
en
AIzaSyAYiBZKx7MnpbEhh9jyipgxe19OcubqV5w
April 1, 2024
255922
Swaziland
SWZ
true
2
1
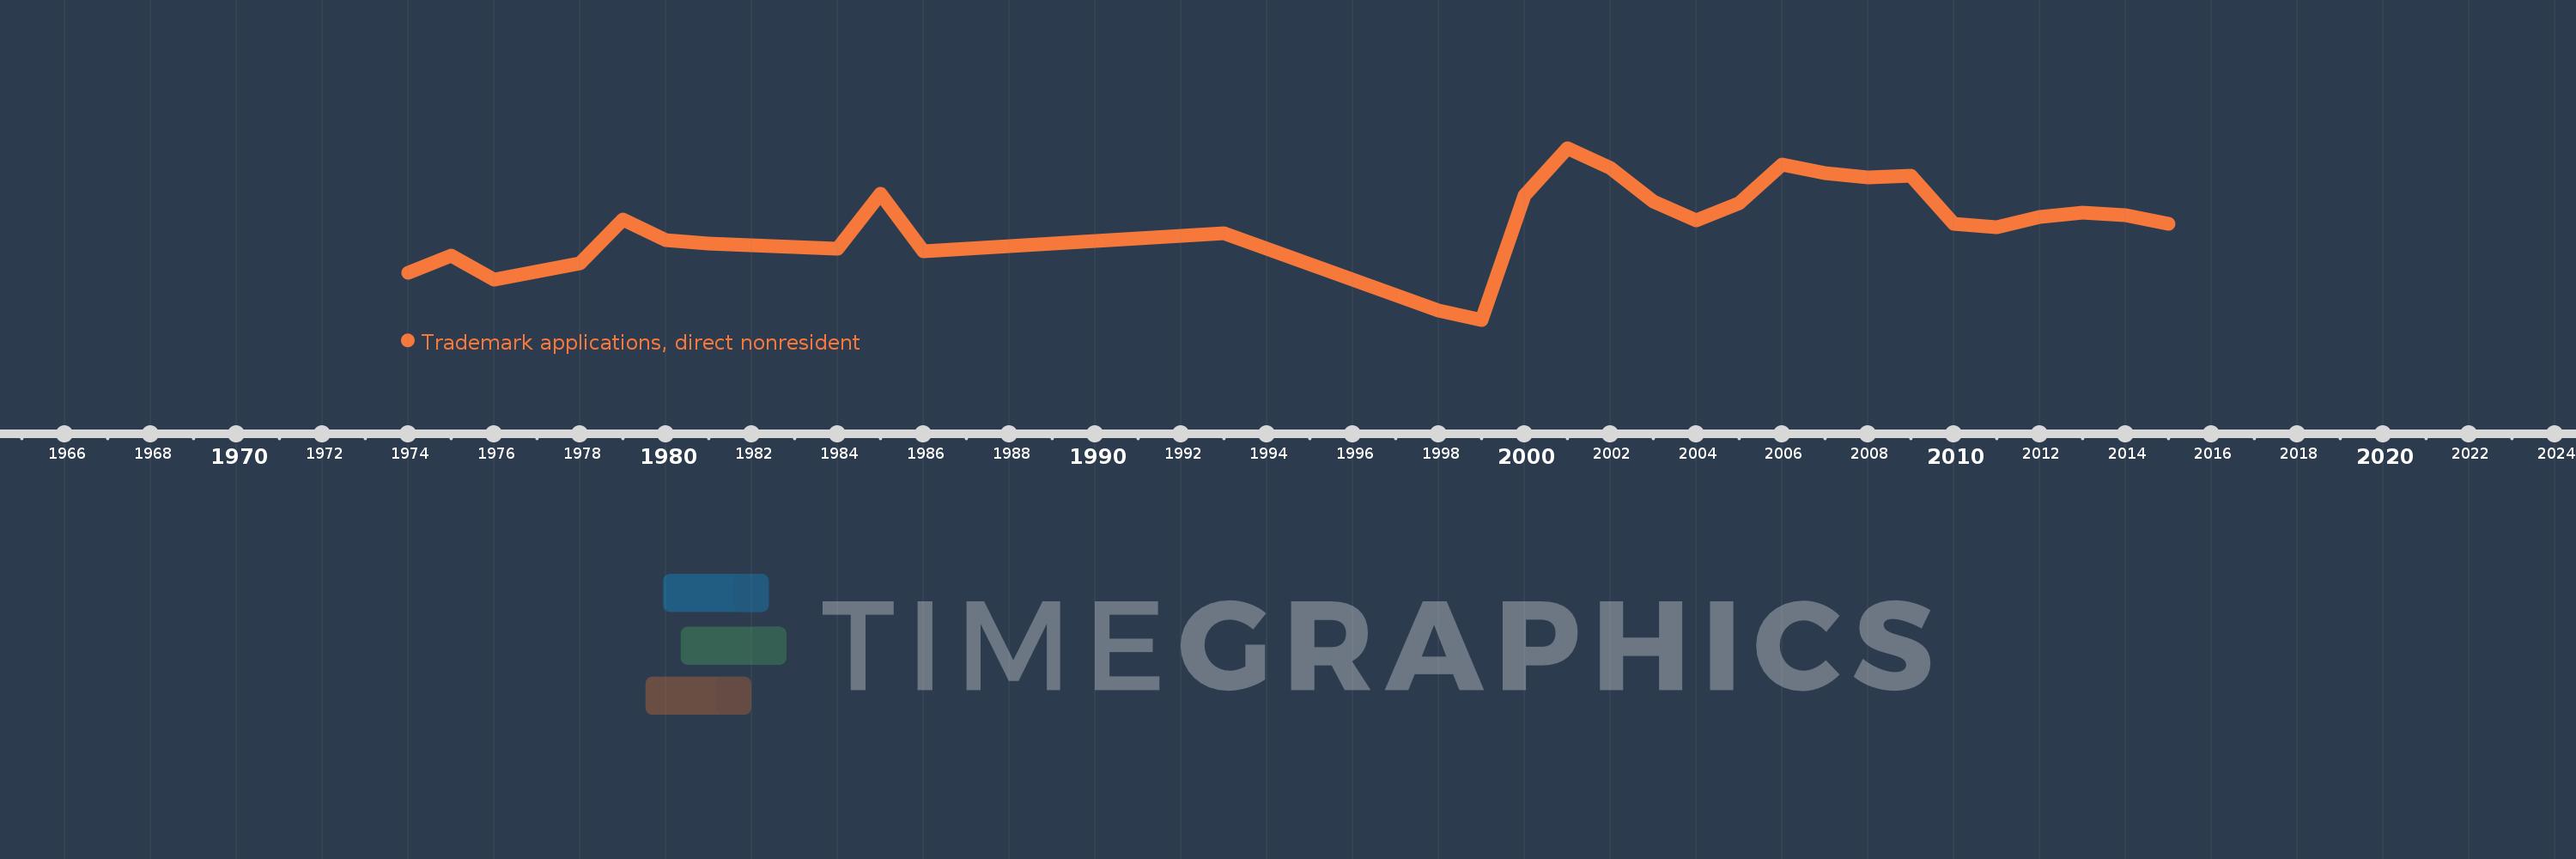
Trademark applications, direct nonresident
2015,2014,2013,2012,2011,2010,2009,2008,2007,2006,2005,2004,2003,2002,2001,2000,1999,1998,1993,1990,1986,1985,1984,1981,1980,1979,1978,1976,1975,1974
This statistics in other country:
AlbaniaAlgeriaAndorraAngolaAntigua and BarbudaArab WorldArgentinaArmeniaArubaAustraliaAustriaAzerbaijanBahamas, TheBahrainBangladeshBarbadosBelarusBelgiumBelizeBhutanBoliviaBosnia and HerzegovinaBotswanaBrazilBrunei DarussalamBulgariaBurundiCambodiaCanadaCaribbean small statesCentral Europe and the BalticsChileChinaColombiaCongo, Dem. Rep.Costa RicaCroatiaCubaCuracaoCyprusCzech RepublicDenmarkDjiboutiDominicaDominican RepublicEarly-demographic dividendEast Asia & PacificEast Asia & Pacific (excluding high income)East Asia & Pacific (IDA & IBRD countries)EcuadorEgypt, Arab Rep.El SalvadorEstoniaEthiopiaEuro areaEurope & Central AsiaEurope & Central Asia (excluding high income)Europe & Central Asia (IDA & IBRD countries)European UnionFijiFinlandFranceGambia, TheGeorgiaGermanyGhanaGreeceGrenadaGuatemalaGuyanaHaitiHigh incomeHondurasHong Kong SAR, ChinaHungaryIBRD onlyIcelandIDA & IBRD totalIDA blendIndiaIndonesiaIran, Islamic Rep.IraqIrelandIsraelItalyJamaicaJapanJordanKazakhstanKenyaKiribatiKorea, Dem. People’s Rep.Korea, Rep.KuwaitKyrgyz RepublicLao PDRLate-demographic dividendLatin America & Caribbean Latin America & Caribbean (excluding high income)Latin America & the Caribbean (IDA & IBRD countries)LatviaLebanonLesothoLiberiaLibyaLiechtensteinLithuaniaLow & middle incomeLower middle incomeLuxembourgMacao SAR, ChinaMacedonia, FYRMadagascarMalawiMalaysiaMaliMaltaMauritiusMexicoMiddle East & North AfricaMiddle East & North Africa (excluding high income)Middle East & North Africa (IDA & IBRD countries)Middle incomeMoldovaMonacoMongoliaMontenegroMoroccoMozambiqueMyanmarNamibiaNepalNetherlandsNew ZealandNicaraguaNigeriaNorth AmericaNorwayOECD membersOmanOther small statesPacific island small statesPakistanPanamaPapua New GuineaParaguayPeruPhilippinesPolandPortugalPost-demographic dividendQatarRomaniaRussian FederationRwandaSamoaSan MarinoSao Tome and PrincipeSaudi ArabiaSerbiaSeychellesSierra LeoneSingaporeSint Maarten (Dutch part)Slovak RepublicSloveniaSmall statesSolomon IslandsSomaliaSouth AfricaSouth AsiaSouth Asia (IDA & IBRD)SpainSri LankaSt. LuciaSt. Vincent and the GrenadinesSudanSurinameSwazilandSwedenSwitzerlandSyrian Arab RepublicTajikistanTanzaniaThailandTongaTrinidad and TobagoTunisiaTurkeyTurkmenistanTuvaluUgandaUkraineUnited Arab EmiratesUnited KingdomUnited StatesUpper middle incomeUruguayUzbekistanVenezuela, RBVietnamWorldYemen, Rep.ZambiaZimbabwe Timeline:
This timeline shows a graph from 1974 to 2015 of Swaziland. No data until 1973. Number of actual observations by date: 30.
Source name:
World Development Indicators
Source organization:
World Intellectual Property Organization (WIPO), WIPO Patent Report: Statistics on Worldwide Patent Activity. The International Bureau of WIPO assumes no responsibility with respect to the transformation of these data.
Categories, topics:
Science & Technology
Last updated:
apr 23, 2017
Indicators value changes by year
At the date of observation
Value
Absolute change
Change from previous value
jan 1, 1974
348.0
+348.0
0.0%
jan 1, 1975
464.0
+116.0
33.33%
jan 1, 1976
306.0
-158.0
-34.05%
jan 1, 1978
413.0
+107.0
34.97%
jan 1, 1979
709.0
+296.0
71.67%
jan 1, 1980
569.0
-140.0
-19.75%
jan 1, 1981
549.0
-20.0
-3.51%
jan 1, 1984
510.0
-39.0
-7.1%
jan 1, 1985
881.0
+371.0
72.75%
jan 1, 1986
492.0
-389.0
-44.15%
jan 1, 1990
565.0
+73.0
14.84%
jan 1, 1993
616.0
+51.0
9.03%
jan 1, 1998
95.0
-521.0
-84.58%
jan 1, 1999
34.0
-61.0
-64.21%
jan 1, 2000
872.0
+838.0
2.46K%
jan 1, 2001
1.19K
+318.0
36.47%
jan 1, 2002
1.054K
-136.0
-11.43%
jan 1, 2003
828.0
-226.0
-21.44%
jan 1, 2004
704.0
-124.0
-14.98%
jan 1, 2005
818.0
+114.0
16.19%
jan 1, 2006
1.077K
+259.0
31.66%
jan 1, 2007
1.02K
-57.0
-5.29%
jan 1, 2008
992.0
-28.0
-2.75%
jan 1, 2009
1.004K
+12.0
1.21%
jan 1, 2010
680.0
-324.0
-32.27%
jan 1, 2011
658.0
-22.0
-3.24%
jan 1, 2012
727.0
+69.0
10.49%
jan 1, 2013
753.0
+26.0
3.58%
jan 1, 2014
740.0
-13.0
-1.73%
jan 1, 2015
679.0
-61.0
-8.24%
Ranking of countries by current statistics by years


Comments: