29
/
en
AIzaSyAYiBZKx7MnpbEhh9jyipgxe19OcubqV5w
April 1, 2024
153180
Hungary
HUN
true
2
1
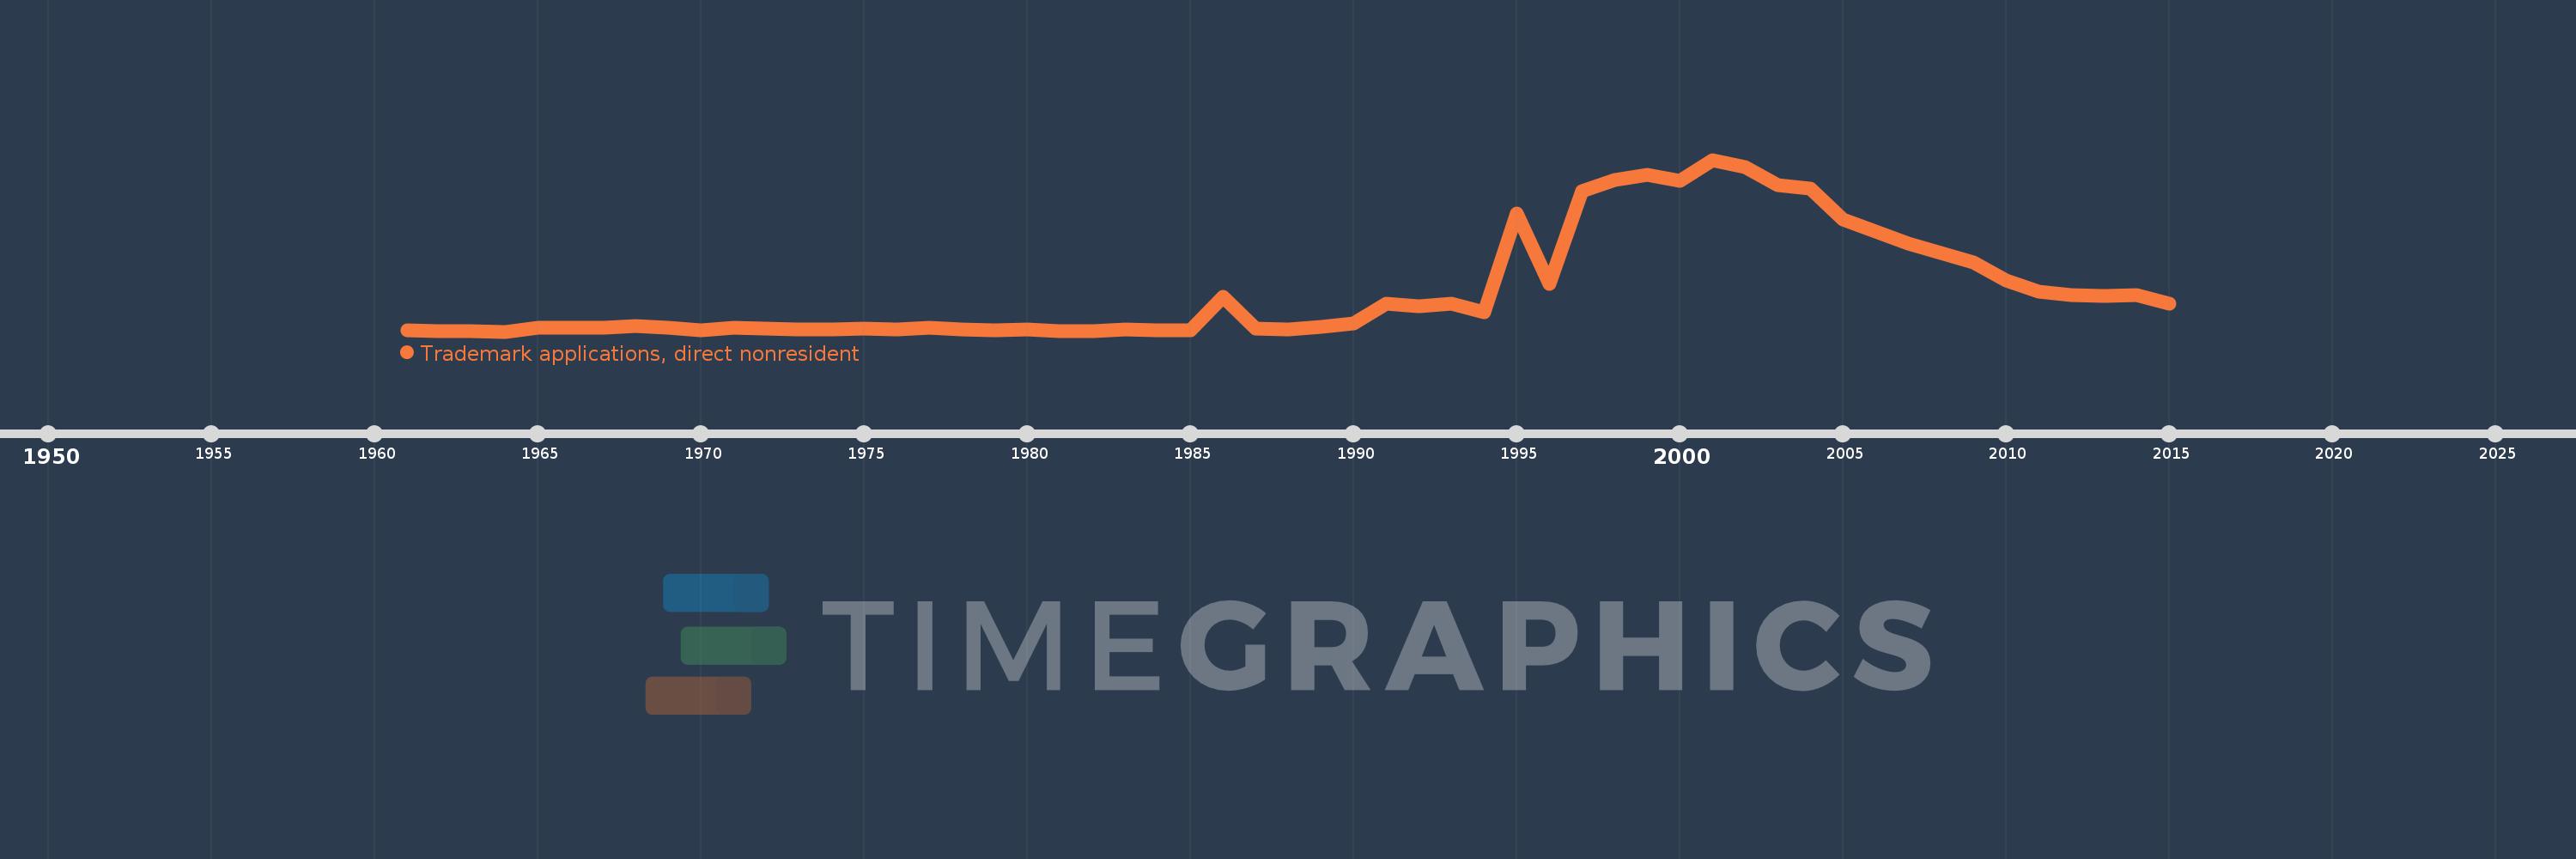
Trademark applications, direct nonresident
2015,2014,2013,2012,2011,2010,2009,2008,2007,2006,2005,2004,2003,2002,2001,2000,1999,1998,1997,1996,1995,1994,1993,1992,1991,1990,1989,1988,1987,1986,1985,1984,1983,1982,1981,1980,1979,1978,1977,1976,1975,1974,1973,1972,1971,1970,1969,1968,1967,1966,1965,1964,1963,1962,1961
This statistics in other country:
AlbaniaAlgeriaAndorraAngolaAntigua and BarbudaArab WorldArgentinaArmeniaArubaAustraliaAustriaAzerbaijanBahamas, TheBahrainBangladeshBarbadosBelarusBelgiumBelizeBhutanBoliviaBosnia and HerzegovinaBotswanaBrazilBrunei DarussalamBulgariaBurundiCambodiaCanadaCaribbean small statesCentral Europe and the BalticsChileChinaColombiaCongo, Dem. Rep.Costa RicaCroatiaCubaCuracaoCyprusCzech RepublicDenmarkDjiboutiDominicaDominican RepublicEarly-demographic dividendEast Asia & PacificEast Asia & Pacific (excluding high income)East Asia & Pacific (IDA & IBRD countries)EcuadorEgypt, Arab Rep.El SalvadorEstoniaEthiopiaEuro areaEurope & Central AsiaEurope & Central Asia (excluding high income)Europe & Central Asia (IDA & IBRD countries)European UnionFijiFinlandFranceGambia, TheGeorgiaGermanyGhanaGreeceGrenadaGuatemalaGuyanaHaitiHigh incomeHondurasHong Kong SAR, ChinaHungaryIBRD onlyIcelandIDA & IBRD totalIDA blendIndiaIndonesiaIran, Islamic Rep.IraqIrelandIsraelItalyJamaicaJapanJordanKazakhstanKenyaKiribatiKorea, Dem. People’s Rep.Korea, Rep.KuwaitKyrgyz RepublicLao PDRLate-demographic dividendLatin America & Caribbean Latin America & Caribbean (excluding high income)Latin America & the Caribbean (IDA & IBRD countries)LatviaLebanonLesothoLiberiaLibyaLiechtensteinLithuaniaLow & middle incomeLower middle incomeLuxembourgMacao SAR, ChinaMacedonia, FYRMadagascarMalawiMalaysiaMaliMaltaMauritiusMexicoMiddle East & North AfricaMiddle East & North Africa (excluding high income)Middle East & North Africa (IDA & IBRD countries)Middle incomeMoldovaMonacoMongoliaMontenegroMoroccoMozambiqueMyanmarNamibiaNepalNetherlandsNew ZealandNicaraguaNigeriaNorth AmericaNorwayOECD membersOmanOther small statesPacific island small statesPakistanPanamaPapua New GuineaParaguayPeruPhilippinesPolandPortugalPost-demographic dividendQatarRomaniaRussian FederationRwandaSamoaSan MarinoSao Tome and PrincipeSaudi ArabiaSerbiaSeychellesSierra LeoneSingaporeSint Maarten (Dutch part)Slovak RepublicSloveniaSmall statesSolomon IslandsSomaliaSouth AfricaSouth AsiaSouth Asia (IDA & IBRD)SpainSri LankaSt. LuciaSt. Vincent and the GrenadinesSudanSurinameSwazilandSwedenSwitzerlandSyrian Arab RepublicTajikistanTanzaniaThailandTongaTrinidad and TobagoTunisiaTurkeyTurkmenistanTuvaluUgandaUkraineUnited Arab EmiratesUnited KingdomUnited StatesUpper middle incomeUruguayUzbekistanVenezuela, RBVietnamWorldYemen, Rep.ZambiaZimbabwe Timeline:
This timeline shows a graph from 1961 to 2015 of Hungary. No data until 1960. Number of actual observations by date: 55.
Source name:
World Development Indicators
Source organization:
World Intellectual Property Organization (WIPO), WIPO Patent Report: Statistics on Worldwide Patent Activity. The International Bureau of WIPO assumes no responsibility with respect to the transformation of these data.
Categories, topics:
Science & Technology
Last updated:
apr 23, 2017
Indicators value changes by year
Maximum:
11.162K
jan 1, 2001
At the date of observation
Value
Absolute change
Change from previous value
jan 1, 1961
216.0
+216.0
0.0%
jan 1, 1962
208.0
-8.0
-3.7%
jan 1, 1963
188.0
-20.0
-9.62%
jan 1, 1964
159.0
-29.0
-15.43%
jan 1, 1965
425.0
+266.0
167.3%
jan 1, 1966
401.0
-24.0
-5.65%
jan 1, 1967
412.0
+11.0
2.74%
jan 1, 1968
527.0
+115.0
27.91%
jan 1, 1969
422.0
-105.0
-19.92%
jan 1, 1970
269.0
-153.0
-36.26%
jan 1, 1971
401.0
+132.0
49.07%
jan 1, 1972
336.0
-65.0
-16.21%
jan 1, 1973
281.0
-55.0
-16.37%
jan 1, 1974
322.0
+41.0
14.59%
jan 1, 1975
342.0
+20.0
6.21%
jan 1, 1976
297.0
-45.0
-13.16%
jan 1, 1977
393.0
+96.0
32.32%
jan 1, 1978
310.0
-83.0
-21.12%
jan 1, 1979
263.0
-47.0
-15.16%
jan 1, 1980
283.0
+20.0
7.6%
jan 1, 1981
200.0
-83.0
-29.33%
jan 1, 1982
210.0
+10.0
5.0%
jan 1, 1983
274.0
+64.0
30.48%
jan 1, 1984
260.0
-14.0
-5.11%
jan 1, 1985
223.0
-37.0
-14.23%
jan 1, 1986
2.394K
+2.171K
973.54%
jan 1, 1987
331.0
-2.063K
-86.17%
jan 1, 1988
302.0
-29.0
-8.76%
jan 1, 1989
478.0
+176.0
58.28%
jan 1, 1990
687.0
+209.0
43.72%
jan 1, 1991
1.958K
+1.271K
185.01%
jan 1, 1992
1.809K
-149.0
-7.61%
jan 1, 1993
1.969K
+160.0
8.84%
jan 1, 1994
1.39K
-579.0
-29.41%
jan 1, 1995
7.704K
+6.314K
454.24%
jan 1, 1996
3.211K
-4.493K
-58.32%
jan 1, 1997
9.132K
+5.921K
184.4%
jan 1, 1998
9.895K
+763.0
8.36%
jan 1, 1999
10.184K
+289.0
2.92%
jan 1, 2000
9.828K
-356.0
-3.5%
jan 1, 2001
11.162K
+1.334K
13.57%
jan 1, 2002
10.673K
-489.0
-4.38%
jan 1, 2003
9.546K
-1.127K
-10.56%
jan 1, 2004
9.315K
-231.0
-2.42%
jan 1, 2005
7.342K
-1.973K
-21.18%
jan 1, 2006
6.587K
-755.0
-10.28%
jan 1, 2007
5.793K
-794.0
-12.05%
jan 1, 2008
5.17K
-623.0
-10.75%
jan 1, 2009
4.607K
-563.0
-10.89%
jan 1, 2010
3.431K
-1.176K
-25.53%
jan 1, 2011
2.705K
-726.0
-21.16%
jan 1, 2012
2.481K
-224.0
-8.28%
jan 1, 2013
2.464K
-17.0
-0.69%
jan 1, 2014
2.477K
+13.0
0.53%
jan 1, 2015
1.949K
-528.0
-21.32%
Ranking of countries by current statistics by years


Comments: